

126
L.M. Mitnik and V.A. Dubina
spaceborne SAR imagery was used extensively in studies of IWs dynamics, but not
so visible imagery. The conditions for IWs imaging by radar and optical sensors are
quite different (Mitnik et al., 2000). While radar imaging is almost independent of
weather conditions, optical imaging requires (at least partially) cloud free conditions
and is strongly dependent on the viewing geometry. Usually, IWs are detected in sun
glint area; however, their contrasts beyond sun glint area may be also high enough
for their detection. When imaging IWs by optical sensors, one has to distinguish
whether the sea surface manifestations of the IWs lie inside, outside the sun glint
area, or in the transition zone. For a flat sea surface, sun glitter is seen when the sun
elevation angle E (measured from the horizon) and the viewing (incidence) angle
I (measured from the vertical) obeys the relationship E + I = 90 ◦ . If the sea is
roughened by surface waves, each facet at the appropriate angle reflects the sun’s
rays to the sensor and a glitter pattern with diminishing brightness outward from
its center results (Cox and Munk, 1954). In the sun glint area IWs become visible
because the sun glitter radiance depends on the slope distribution of the surface
waves, which is modulated by the surface current associated with the IWs. In the
non-sun glint area IWs become visible because the diffuse reflection of sunlight
depends also on the slope distribution of the surface waves. Wave breaking and
appearance of foam patches can contribute significantly in optical contrast. This
phenomenon is typical for intense fast-moving IWs.
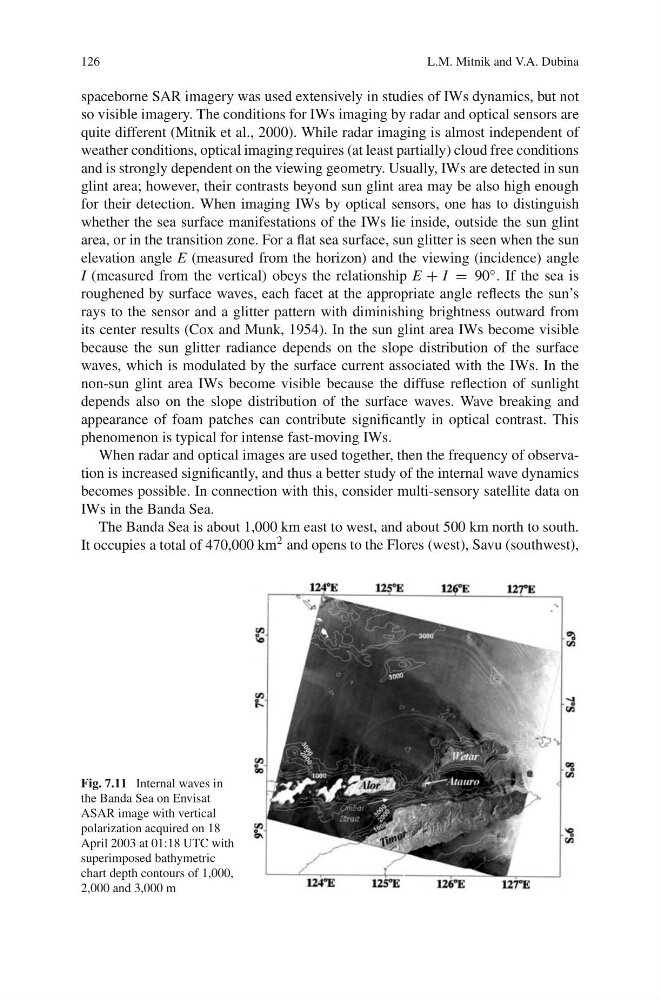
When radar and optical images are used together, then the frequency of observation is increased significantly, and thus a better study of the internal wave dynamics
becomes possible. In connection with this, consider multi-sensory satellite data on
IWs in the Banda Sea.
The Banda Sea is about 1,000 km east to west, and about 500 km north to south.
It occupies a total of 470,000 km 2 and opens to the Flores (west), Savu (southwest),
Fig. 7.11 Internal waves in
the Banda Sea on Envisat
ASAR image with vertical
polarization acquired on 18
April 2003 at 01:18 UTC with
superimposed bathymetric
chart depth contours of 1,000,
2,000 and 3,000 m
L.M. Mitnik and V.A. Dubina
spaceborne SAR imagery was used extensively in studies of IWs dynamics, but not
so visible imagery. The conditions for IWs imaging by radar and optical sensors are
quite different (Mitnik et al., 2000). While radar imaging is almost independent of
weather conditions, optical imaging requires (at least partially) cloud free conditions
and is strongly dependent on the viewing geometry. Usually, IWs are detected in sun
glint area; however, their contrasts beyond sun glint area may be also high enough
for their detection. When imaging IWs by optical sensors, one has to distinguish
whether the sea surface manifestations of the IWs lie inside, outside the sun glint
area, or in the transition zone. For a flat sea surface, sun glitter is seen when the sun
elevation angle E (measured from the horizon) and the viewing (incidence) angle
I (measured from the vertical) obeys the relationship E + I = 90 ◦ . If the sea is
roughened by surface waves, each facet at the appropriate angle reflects the sun’s
rays to the sensor and a glitter pattern with diminishing brightness outward from
its center results (Cox and Munk, 1954). In the sun glint area IWs become visible
because the sun glitter radiance depends on the slope distribution of the surface
waves, which is modulated by the surface current associated with the IWs. In the
non-sun glint area IWs become visible because the diffuse reflection of sunlight
depends also on the slope distribution of the surface waves. Wave breaking and
appearance of foam patches can contribute significantly in optical contrast. This
phenomenon is typical for intense fast-moving IWs.
When radar and optical images are used together, then the frequency of observation is increased significantly, and thus a better study of the internal wave dynamics
becomes possible. In connection with this, consider multi-sensory satellite data on
IWs in the Banda Sea.
The Banda Sea is about 1,000 km east to west, and about 500 km north to south.
It occupies a total of 470,000 km 2 and opens to the Flores (west), Savu (southwest),
Fig. 7.11 Internal waves in
the Banda Sea on Envisat
ASAR image with vertical
polarization acquired on 18
April 2003 at 01:18 UTC with
superimposed bathymetric
chart depth contours of 1,000,
2,000 and 3,000 m