

7 Interpretation of SAR Signatures of the Sea Surface
125
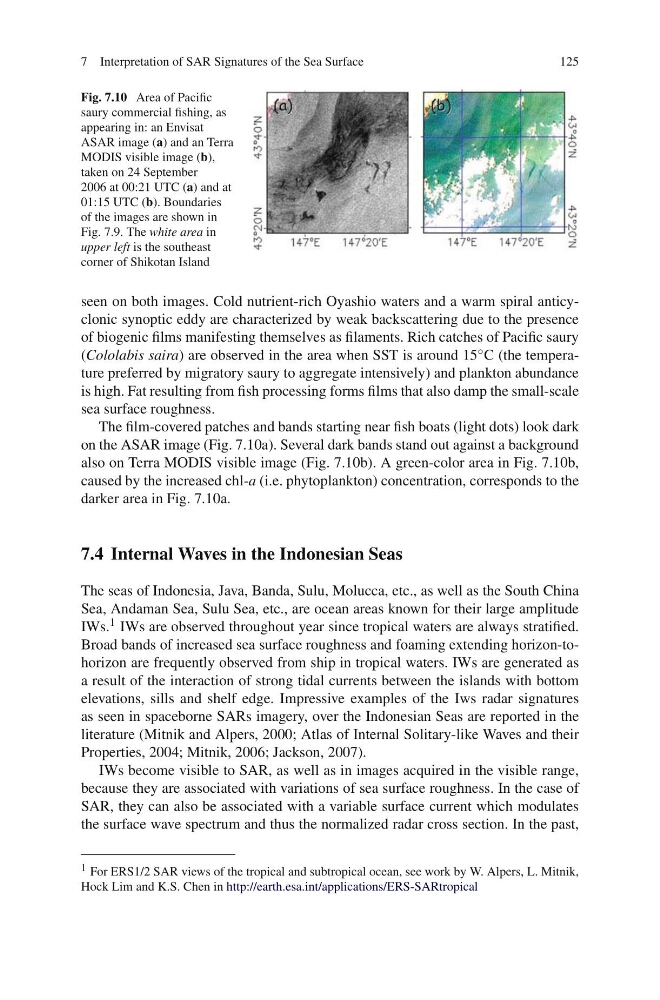
Fig. 7.10 Area of Pacific
saury commercial fishing, as
appearing in: an Envisat
ASAR image (a) and an Terra
MODIS visible image (b),
taken on 24 September
2006 at 00:21 UTC (a) and at
01:15 UTC (b). Boundaries
of the images are shown in
Fig. 7.9. The white area in
upper left is the southeast
corner of Shikotan Island
seen on both images. Cold nutrient-rich Oyashio waters and a warm spiral anticyclonic synoptic eddy are characterized by weak backscattering due to the presence
of biogenic films manifesting themselves as filaments. Rich catches of Pacific saury
(Cololabis saira) are observed in the area when SST is around 15 ◦ C (the temperature preferred by migratory saury to aggregate intensively) and plankton abundance
is high. Fat resulting from fish processing forms films that also damp the small-scale
sea surface roughness.
The film-covered patches and bands starting near fish boats (light dots) look dark
on the ASAR image (Fig. 7.10a). Several dark bands stand out against a background
also on Terra MODIS visible image (Fig. 7.10b). A green-color area in Fig. 7.10b,
caused by the increased chl-a (i.e. phytoplankton) concentration, corresponds to the
darker area in Fig. 7.10a.
7.4 Internal Waves in the Indonesian Seas
The seas of Indonesia, Java, Banda, Sulu, Molucca, etc., as well as the South China
Sea, Andaman Sea, Sulu Sea, etc., are ocean areas known for their large amplitude
IWs. 1 IWs are observed throughout year since tropical waters are always stratified.
Broad bands of increased sea surface roughness and foaming extending horizon-tohorizon are frequently observed from ship in tropical waters. IWs are generated as
a result of the interaction of strong tidal currents between the islands with bottom
elevations, sills and shelf edge. Impressive examples of the Iws radar signatures
as seen in spaceborne SARs imagery, over the Indonesian Seas are reported in the
literature (Mitnik and Alpers, 2000; Atlas of Internal Solitary-like Waves and their
Properties, 2004; Mitnik, 2006; Jackson, 2007).
IWs become visible to SAR, as well as in images acquired in the visible range,
because they are associated with variations of sea surface roughness. In the case of
SAR, they can also be associated with a variable surface current which modulates
the surface wave spectrum and thus the normalized radar cross section. In the past,
1 For ERS1/2 SAR views of the tropical and subtropical ocean, see work by W. Alpers, L. Mitnik,
Hock Lim and K.S. Chen in http://earth.esa.int/applications/ERS-SARtropical
125
Fig. 7.10 Area of Pacific
saury commercial fishing, as
appearing in: an Envisat
ASAR image (a) and an Terra
MODIS visible image (b),
taken on 24 September
2006 at 00:21 UTC (a) and at
01:15 UTC (b). Boundaries
of the images are shown in
Fig. 7.9. The white area in
upper left is the southeast
corner of Shikotan Island
seen on both images. Cold nutrient-rich Oyashio waters and a warm spiral anticyclonic synoptic eddy are characterized by weak backscattering due to the presence
of biogenic films manifesting themselves as filaments. Rich catches of Pacific saury
(Cololabis saira) are observed in the area when SST is around 15 ◦ C (the temperature preferred by migratory saury to aggregate intensively) and plankton abundance
is high. Fat resulting from fish processing forms films that also damp the small-scale
sea surface roughness.
The film-covered patches and bands starting near fish boats (light dots) look dark
on the ASAR image (Fig. 7.10a). Several dark bands stand out against a background
also on Terra MODIS visible image (Fig. 7.10b). A green-color area in Fig. 7.10b,
caused by the increased chl-a (i.e. phytoplankton) concentration, corresponds to the
darker area in Fig. 7.10a.
7.4 Internal Waves in the Indonesian Seas
The seas of Indonesia, Java, Banda, Sulu, Molucca, etc., as well as the South China
Sea, Andaman Sea, Sulu Sea, etc., are ocean areas known for their large amplitude
IWs. 1 IWs are observed throughout year since tropical waters are always stratified.
Broad bands of increased sea surface roughness and foaming extending horizon-tohorizon are frequently observed from ship in tropical waters. IWs are generated as
a result of the interaction of strong tidal currents between the islands with bottom
elevations, sills and shelf edge. Impressive examples of the Iws radar signatures
as seen in spaceborne SARs imagery, over the Indonesian Seas are reported in the
literature (Mitnik and Alpers, 2000; Atlas of Internal Solitary-like Waves and their
Properties, 2004; Mitnik, 2006; Jackson, 2007).
IWs become visible to SAR, as well as in images acquired in the visible range,
because they are associated with variations of sea surface roughness. In the case of
SAR, they can also be associated with a variable surface current which modulates
the surface wave spectrum and thus the normalized radar cross section. In the past,
1 For ERS1/2 SAR views of the tropical and subtropical ocean, see work by W. Alpers, L. Mitnik,
Hock Lim and K.S. Chen in http://earth.esa.int/applications/ERS-SARtropical