

124
L.M. Mitnik and V.A. Dubina
soliton. Their presence confirms that the water stratification and current velocities
were favorable for IWs generation. Several factors influence the accuracy of the
retrieved V values: time interval between two images and accuracy of their coordinate relation; speed and movement direction of a SAR signature; its contrast against
the background; pixel size, etc. The mean error of the signature speed determination
was approximately 0.15 m/s.
The pair of Envisat ASAR and ERS-2 SAR images is not only a good example,
but also a good basis for the detailed study of surface currents. The derived estimates of speeds and directions of a number of selected SAR signatures may serve
for the assessment of “first-guess flows”, to retrieve current fields from radar data
with the help of a radar imaging model. The proximity of the oceanic features to
the coast improves georeference and gives a fine opportunity to the current field
reconstruction.
7.3.4 Oyashio-Kuroshio Frontal Zone
Intense mesoscale eddies are observed in the subarctic frontal zone east of Japan,
where the warm Kuroshio waters interact with cold Oyashio waters. The probability
of clouds over this zone is high. SAR data, together with IR data, help to monitor
eddy formations and trace their evolution. Radar contrasts of eddies against the surrounding waters are determined not only by the differences in SST, influencing the
stability of the marine boundary layer in the atmosphere, but also by several other
factors, such as surface current velocity and its direction relative to the local wind
direction, surface wind speed, concentration of biogenic films.
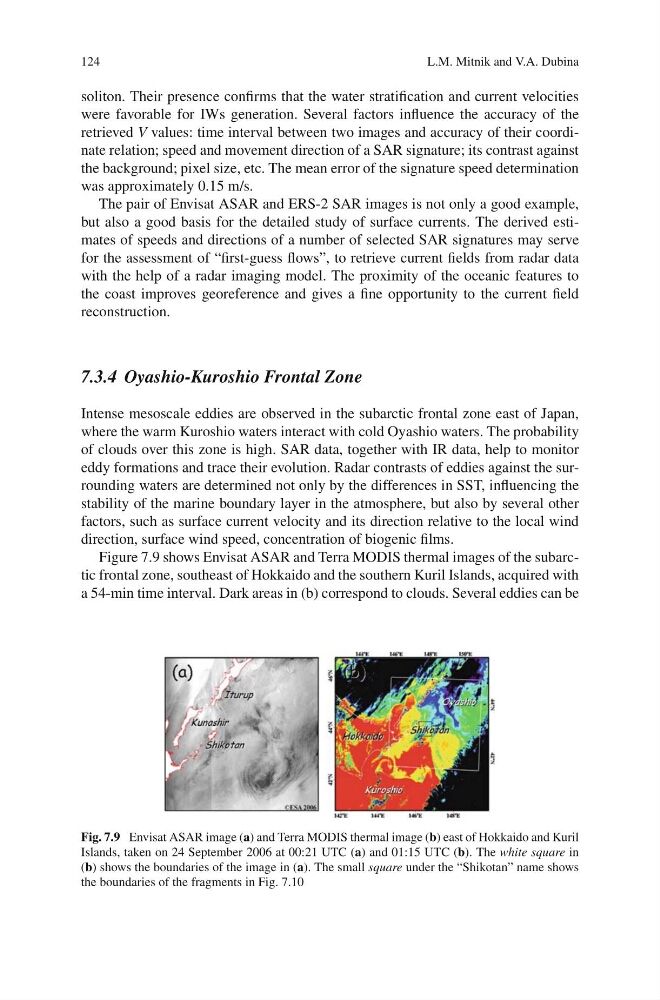
Figure 7.9 shows Envisat ASAR and Terra MODIS thermal images of the subarctic frontal zone, southeast of Hokkaido and the southern Kuril Islands, acquired with
a 54-min time interval. Dark areas in (b) correspond to clouds. Several eddies can be
Fig. 7.9 Envisat ASAR image (a) and Terra MODIS thermal image (b) east of Hokkaido and Kuril
Islands, taken on 24 September 2006 at 00:21 UTC (a) and 01:15 UTC (b). The white square in
(b) shows the boundaries of the image in (a). The small square under the “Shikotan” name shows
the boundaries of the fragments in Fig. 7.10
L.M. Mitnik and V.A. Dubina
soliton. Their presence confirms that the water stratification and current velocities
were favorable for IWs generation. Several factors influence the accuracy of the
retrieved V values: time interval between two images and accuracy of their coordinate relation; speed and movement direction of a SAR signature; its contrast against
the background; pixel size, etc. The mean error of the signature speed determination
was approximately 0.15 m/s.
The pair of Envisat ASAR and ERS-2 SAR images is not only a good example,
but also a good basis for the detailed study of surface currents. The derived estimates of speeds and directions of a number of selected SAR signatures may serve
for the assessment of “first-guess flows”, to retrieve current fields from radar data
with the help of a radar imaging model. The proximity of the oceanic features to
the coast improves georeference and gives a fine opportunity to the current field
reconstruction.
7.3.4 Oyashio-Kuroshio Frontal Zone
Intense mesoscale eddies are observed in the subarctic frontal zone east of Japan,
where the warm Kuroshio waters interact with cold Oyashio waters. The probability
of clouds over this zone is high. SAR data, together with IR data, help to monitor
eddy formations and trace their evolution. Radar contrasts of eddies against the surrounding waters are determined not only by the differences in SST, influencing the
stability of the marine boundary layer in the atmosphere, but also by several other
factors, such as surface current velocity and its direction relative to the local wind
direction, surface wind speed, concentration of biogenic films.
Figure 7.9 shows Envisat ASAR and Terra MODIS thermal images of the subarctic frontal zone, southeast of Hokkaido and the southern Kuril Islands, acquired with
a 54-min time interval. Dark areas in (b) correspond to clouds. Several eddies can be
Fig. 7.9 Envisat ASAR image (a) and Terra MODIS thermal image (b) east of Hokkaido and Kuril
Islands, taken on 24 September 2006 at 00:21 UTC (a) and 01:15 UTC (b). The white square in
(b) shows the boundaries of the image in (a). The small square under the “Shikotan” name shows
the boundaries of the fragments in Fig. 7.10