

100
W.T. Liu et al.
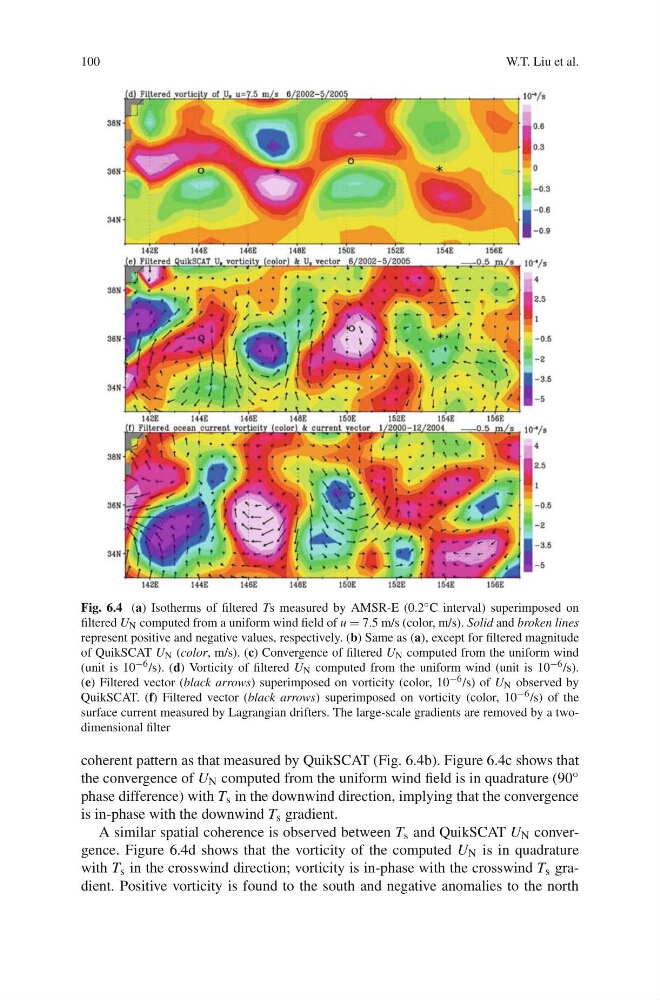
Fig. 6.4 (a) Isotherms of filtered Ts measured by AMSR-E (0.2 ◦ C interval) superimposed on
filtered U N computed from a uniform wind field of u = 7.5 m/s (color, m/s). Solid and broken lines
represent positive and negative values, respectively. (b) Same as (a), except for filtered magnitude
of QuikSCAT U N (color, m/s). (c) Convergence of filtered U N computed from the uniform wind
(unit is 10 −6 /s). (d) Vorticity of filtered U N computed from the uniform wind (unit is 10 −6 /s).
(e) Filtered vector (black arrows) superimposed on vorticity (color, 10 −6 /s) of U N observed by
QuikSCAT. (f) Filtered vector (black arrows) superimposed on vorticity (color, 10 −6 /s) of the
surface current measured by Lagrangian drifters. The large-scale gradients are removed by a twodimensional filter
coherent pattern as that measured by QuikSCAT (Fig. 6.4b). Figure 6.4c shows that
the convergence of U N computed from the uniform wind field is in quadrature (90 ◦
phase difference) with T s in the downwind direction, implying that the convergence
is in-phase with the downwind T s gradient.
A similar spatial coherence is observed between T s and QuikSCAT U N convergence. Figure 6.4d shows that the vorticity of the computed U N is in quadrature
with T s in the crosswind direction; vorticity is in-phase with the crosswind T s gradient. Positive vorticity is found to the south and negative anomalies to the north
W.T. Liu et al.
Fig. 6.4 (a) Isotherms of filtered Ts measured by AMSR-E (0.2 ◦ C interval) superimposed on
filtered U N computed from a uniform wind field of u = 7.5 m/s (color, m/s). Solid and broken lines
represent positive and negative values, respectively. (b) Same as (a), except for filtered magnitude
of QuikSCAT U N (color, m/s). (c) Convergence of filtered U N computed from the uniform wind
(unit is 10 −6 /s). (d) Vorticity of filtered U N computed from the uniform wind (unit is 10 −6 /s).
(e) Filtered vector (black arrows) superimposed on vorticity (color, 10 −6 /s) of U N observed by
QuikSCAT. (f) Filtered vector (black arrows) superimposed on vorticity (color, 10 −6 /s) of the
surface current measured by Lagrangian drifters. The large-scale gradients are removed by a twodimensional filter
coherent pattern as that measured by QuikSCAT (Fig. 6.4b). Figure 6.4c shows that
the convergence of U N computed from the uniform wind field is in quadrature (90 ◦
phase difference) with T s in the downwind direction, implying that the convergence
is in-phase with the downwind T s gradient.
A similar spatial coherence is observed between T s and QuikSCAT U N convergence. Figure 6.4d shows that the vorticity of the computed U N is in quadrature
with T s in the crosswind direction; vorticity is in-phase with the crosswind T s gradient. Positive vorticity is found to the south and negative anomalies to the north