

rms [cm]
Doppler
Doppler
Doppler
Doppler
GPS
(stations)
Europe
N. America
S-E Asia
Australia
Europe
70 x 70:
GFZ95A
206 (131)
117 (167)
277 (99)
181 (232)
78 (64)
OSU91A
213 (132)
115 (167)
289 (99)
179 (231)
92 (65)
GRIM4-C4B
197 (130)
U2 (168)
282 (99)
184 (231)
77 (64)
JGM-3
178 (U8)
111 (166)
278 (99)
175 (231)
96 (65)
360360:
GFZ95A
142 (U7)
107 (171)
276 (100)
152 (232)
35 (61)
OSU91A
132 (126)
103 (170)
289 (100)
149 (232)
51 (66)
Table 2: Geoid Height Differences on Doppler/GPS Stations
and a statistic with a 30- criterion is done. Comparisons are performed for the truncated
series (degree and order 70) and the complete series, and are summarized in table 2.
From the numbers no general trend for the quality of the models can be seen. For the long
wavelengths, a slightly better result is obtained for the truncated high resolution models
than for the long wavelength models. This is in contrast to the orbital fit tests of table 1.
Comparing GFZ95A and OSU9IA, for the long wavelengths GFZ95A shows better results,
while for the complete series the OSU91A model has some smaller rms difference values.
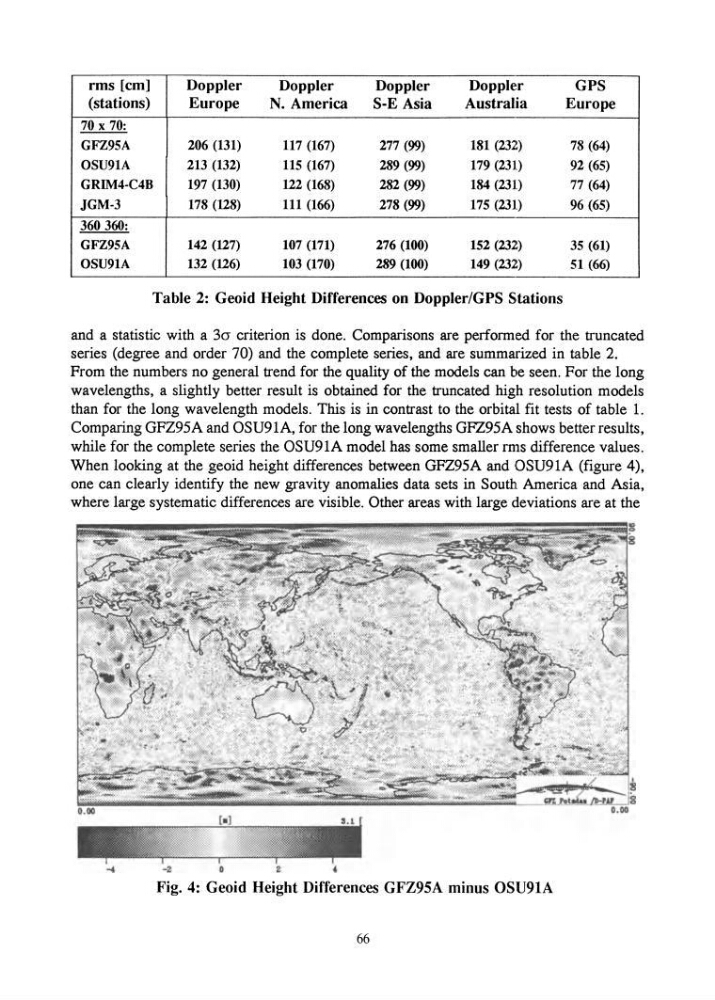
When looking at the geoid height differences between GFZ95A and OSU91A (figure 4),
one can clearly identify the new gravity anomalies data sets in South America and Asia,
where large systematic differences are visible. Other areas with large deviations are at the
Fig. 4: Geoid Height Differences GFZ95A minus OSU91A
66
Doppler
Doppler
Doppler
Doppler
GPS
(stations)
Europe
N. America
S-E Asia
Australia
Europe
70 x 70:
GFZ95A
206 (131)
117 (167)
277 (99)
181 (232)
78 (64)
OSU91A
213 (132)
115 (167)
289 (99)
179 (231)
92 (65)
GRIM4-C4B
197 (130)
U2 (168)
282 (99)
184 (231)
77 (64)
JGM-3
178 (U8)
111 (166)
278 (99)
175 (231)
96 (65)
360360:
GFZ95A
142 (U7)
107 (171)
276 (100)
152 (232)
35 (61)
OSU91A
132 (126)
103 (170)
289 (100)
149 (232)
51 (66)
Table 2: Geoid Height Differences on Doppler/GPS Stations
and a statistic with a 30- criterion is done. Comparisons are performed for the truncated
series (degree and order 70) and the complete series, and are summarized in table 2.
From the numbers no general trend for the quality of the models can be seen. For the long
wavelengths, a slightly better result is obtained for the truncated high resolution models
than for the long wavelength models. This is in contrast to the orbital fit tests of table 1.
Comparing GFZ95A and OSU9IA, for the long wavelengths GFZ95A shows better results,
while for the complete series the OSU91A model has some smaller rms difference values.
When looking at the geoid height differences between GFZ95A and OSU91A (figure 4),
one can clearly identify the new gravity anomalies data sets in South America and Asia,
where large systematic differences are visible. Other areas with large deviations are at the
Fig. 4: Geoid Height Differences GFZ95A minus OSU91A
66