

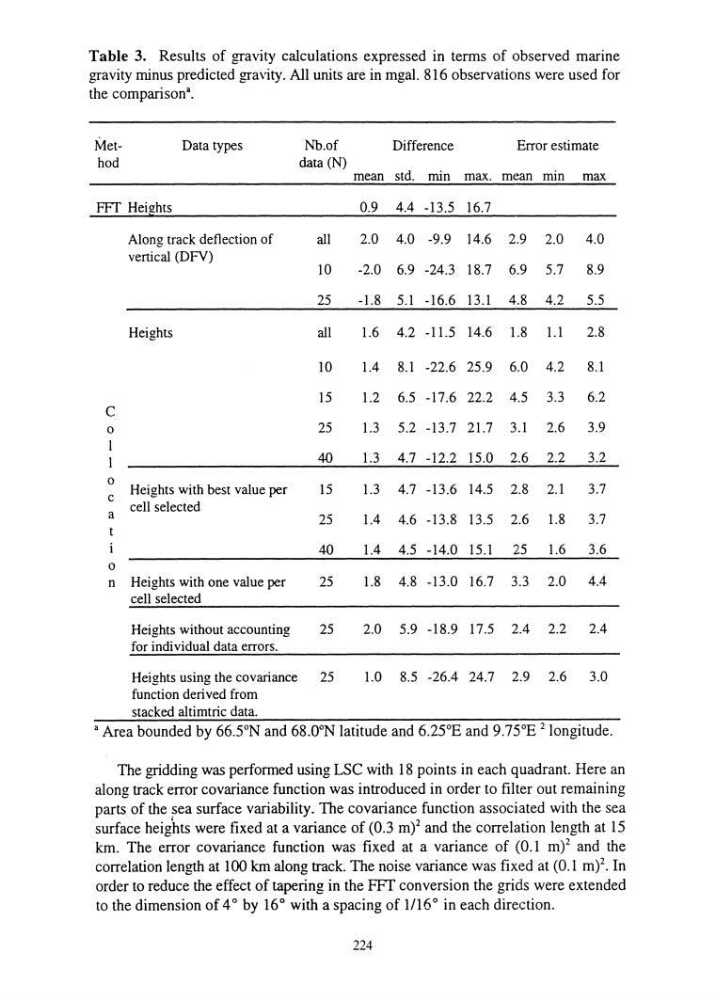
Table 3. Results of gravity calculations expressed in terms of observed marine
gravity minus predicted gravity. All units are in mgal. 816 observations were used for
the comparison a •
MetData types
Nb.of
Difference
Error estimate
hod
data (N) mean std. min max. mean min max
FFf Heights
0.9 4.4 -13.5 16.7
Along track deflection of
all
2.0 4.0 -9.9 14.6 2.9 2.0 4.0
vertical (DFV)
10
-2.0 6.9 -24.3 18.7 6.9 5.7 8.9
25
-1.8 5.1 -16.6 13.1 4.8 4.2 5.5
Heights
all
1.6 4.2 -11.5 14.6 1.8 1.1
2.8
10
1.4 8.1 -22.6 25.9 6.0 4.2 8.1
15
1.2 6.5 -17.6 22.2 4.5 3.3 6.2
C
0
25
1.3 5.2 -13.7 21.7 3.1 2.6 3.9
I
I
40
1.3 4.7 -12.2 15.0 2.6 2.2 3.2
0
Heights with best value per
15
1.3 4.7 -13.6 14.5 2.8
3.7
2.1
c cell selected
a
25
1.4 4.6 -13.8 13.5 2.6 1.8 3.7
t
40
1.4 4.5 -14.0 15.1 25 1.6 3.6
0
n Heights with one value per
25
1.8 4.8 -13.0 16.7 3.3 2.0 4.4
cell selected
Heights without accounting
25
2.0 5.9 -18.9 17.5 2.4 2.2 2.4
for individual data errors.
Heights using the covariance
25
1.0 8.5 -26.4 24.7 2.9 2.6 3.0
function derived from
stacked altimtric data.
a Area bounded by 66.5°N and 68.0 o N latitude and 6.25°E and 9.75°E 2 longitude.
The gridding was performed using LSC with 18 points in each quadrant. Here an
along track error covariance function was introduced in order to filter out remaining
parts of the sea surface variability. The covariance function associated with the sea
surface heights were fixed at a variance of (0.3 m)2 and the correlation length at 15
km. The error covariance function was fixed at a variance of (0.1 m)2 and the
correlation length at 100 km along track. The noise variance was fixed at (0.1 m)2. In
order to reduce the effect of tapering in the FFf conversion the grids were extended
to the dimension of 4
0
by 16
0
with a spacing of 1116
0
in each direction.
224
gravity minus predicted gravity. All units are in mgal. 816 observations were used for
the comparison a •
MetData types
Nb.of
Difference
Error estimate
hod
data (N) mean std. min max. mean min max
FFf Heights
0.9 4.4 -13.5 16.7
Along track deflection of
all
2.0 4.0 -9.9 14.6 2.9 2.0 4.0
vertical (DFV)
10
-2.0 6.9 -24.3 18.7 6.9 5.7 8.9
25
-1.8 5.1 -16.6 13.1 4.8 4.2 5.5
Heights
all
1.6 4.2 -11.5 14.6 1.8 1.1
2.8
10
1.4 8.1 -22.6 25.9 6.0 4.2 8.1
15
1.2 6.5 -17.6 22.2 4.5 3.3 6.2
C
0
25
1.3 5.2 -13.7 21.7 3.1 2.6 3.9
I
I
40
1.3 4.7 -12.2 15.0 2.6 2.2 3.2
0
Heights with best value per
15
1.3 4.7 -13.6 14.5 2.8
3.7
2.1
c cell selected
a
25
1.4 4.6 -13.8 13.5 2.6 1.8 3.7
t
40
1.4 4.5 -14.0 15.1 25 1.6 3.6
0
n Heights with one value per
25
1.8 4.8 -13.0 16.7 3.3 2.0 4.4
cell selected
Heights without accounting
25
2.0 5.9 -18.9 17.5 2.4 2.2 2.4
for individual data errors.
Heights using the covariance
25
1.0 8.5 -26.4 24.7 2.9 2.6 3.0
function derived from
stacked altimtric data.
a Area bounded by 66.5°N and 68.0 o N latitude and 6.25°E and 9.75°E 2 longitude.
The gridding was performed using LSC with 18 points in each quadrant. Here an
along track error covariance function was introduced in order to filter out remaining
parts of the sea surface variability. The covariance function associated with the sea
surface heights were fixed at a variance of (0.3 m)2 and the correlation length at 15
km. The error covariance function was fixed at a variance of (0.1 m)2 and the
correlation length at 100 km along track. The noise variance was fixed at (0.1 m)2. In
order to reduce the effect of tapering in the FFf conversion the grids were extended
to the dimension of 4
0
by 16
0
with a spacing of 1116
0
in each direction.
224