

REliEF REPRESENTATION
In the third part of the product validation a shaded view of the sea surface is performed
visualizing empirically the model's fIrst derivative. Unrealistic gradients, for example
from insuffIciently removed orbit errors, cause sharp differences in the brightness between
310 0 W
310 0 W
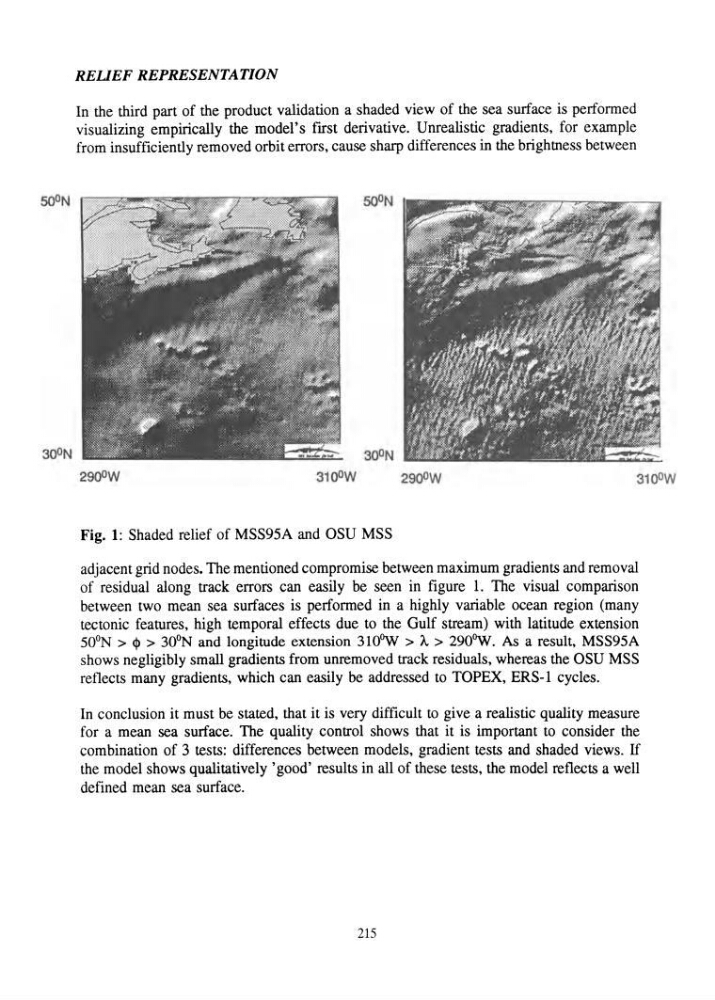
Fig. 1: Shaded relief of MSS95A and OSU MSS
adjacent grid nodes. The mentioned compromise between maximum gradients and removal
of residual along track errors can easily be seen in fIgure 1. The visual comparison
between two mean sea surfaces is performed in a highly variable ocean region (many
tectonic features, high temporal effects due to the Gulf stream) with latitude extension
SOoN>
In the third part of the product validation a shaded view of the sea surface is performed
visualizing empirically the model's fIrst derivative. Unrealistic gradients, for example
from insuffIciently removed orbit errors, cause sharp differences in the brightness between
310 0 W
310 0 W
Fig. 1: Shaded relief of MSS95A and OSU MSS
adjacent grid nodes. The mentioned compromise between maximum gradients and removal
of residual along track errors can easily be seen in fIgure 1. The visual comparison
between two mean sea surfaces is performed in a highly variable ocean region (many
tectonic features, high temporal effects due to the Gulf stream) with latitude extension
SOoN>
30 0 N and longitude extension 3100W > A > 290OW. As a result, MSS95A
shows negligibly small gradients from unremoved track residuals, whereas the OSU MSS
reflects many gradients, which can easily be addressed to TOPEX, ERS-l cycles.
In conclusion it must be stated, that it is very diffIcult to give a realistic quality measure
for a mean sea surface. The quality control shows that it is important to consider the
combination of 3 tests: differences between models, gradient tests and shaded views. If
the model shows qualitatively' good' results in all of these tests, the model reflects a well
defined mean sea surface.
215