

Table 3. Results of Comparisons of 6841 30' x30'
6g
Field for China (mGal)
Bias
RMS
Min
Max
6g - OSU91A
-6.01
21.13
-101.19
93.86
6g - DQM94(1)
-5.61
13.03
-81.14
45.58
6g - DQM94(2)
-5.35
10.66
-66.51
35.15
6g - DQM94(3)
-5.16
9.65
-60.07
32.32
6g - DQM94( 4)
-5.01
9.09
-54.99
31.13
6g - DQM94( 5)
-4.90
8.71
-50.79
30.38
6g - DQM94(6)
-4.79
8.44
-47.15
29.81
6g - DQM94(7)
-4.70
8.23
-43.98
29.36
6g - DQM94( 8)
-4.62
8.05
-41.21
29.01
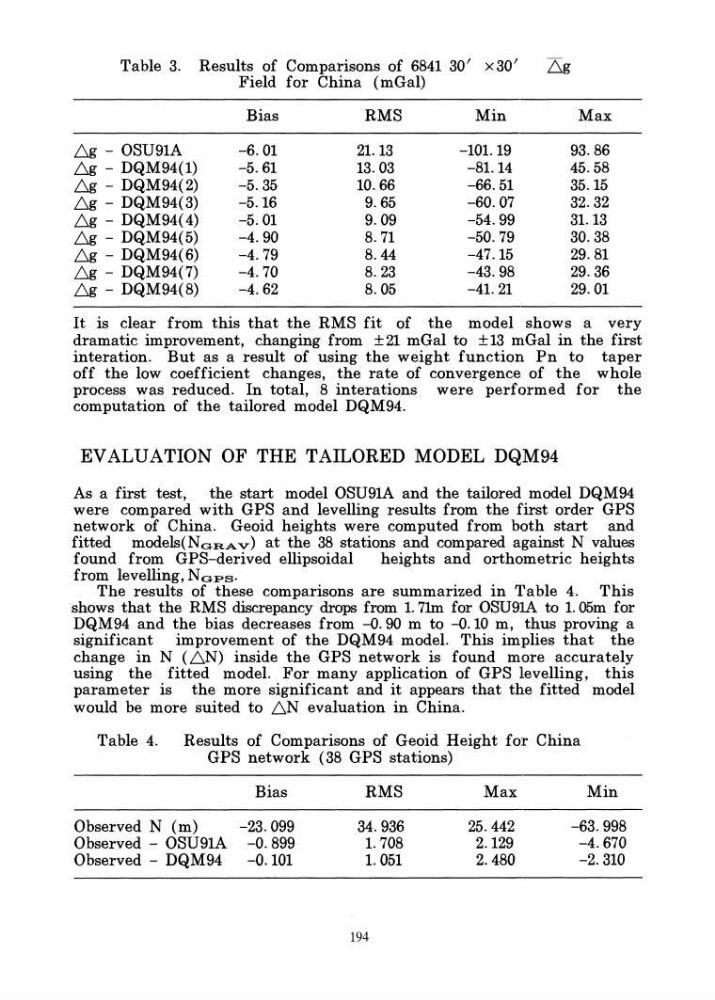
It is clear from this that the RMS fit of the model shows a very
dramatic improvement, changing from ± 21 mGal to ± 13 mGal in the first
interation. But as a result of using the weight function Pn to taper
off the low coefficient changes, the rate of convergence of the whole
process was reduced. In total, 8 interations were performed for the
computation of the tailored model DQM94.
EVALUATION OF THE TAILORED MODEL DQM94
As a first test, the start model OSU91A and the tailored model DQM94
were compared with GPS and levelling results from the first order GPS
network of China. Geoid heights were computed from both start and
fitted models(NoRAv) at the 38 stations and compared against N values
found from GPS-derived ellipsoidal
heights and orthometric heights
from levelling, N OPS.
The results of these comparisons are summarized in Table 4. This
shows that the RMS discrepancy drops from 1. 11m for OSU91A to 1. 05m for
DQM94 and the bias decreases from -0.90 m to -0.10 m, thus proving a
significant improvement of the DQM94 model. This implies that the
change in N (.6N) inside the GPS network is found more accurately
using the fitted model. For many application of GPS levelling, this
parameter is the more significant and it appears that the fitted model
would be more suited to .6N evaluation in China.
Table 4.
Results of Comparisons of Geoid Height for China
GPS network (38 GPS stations)
Observed N (m)
Observed - OSU91A
Observed - DQM94
Bias
-23.099
-0.899
-0.101
RMS
34.936
1. 708
1.051
194
Max
25.442
2.129
2.480
Min
-63.998
-4.670
-2.310
6g
Field for China (mGal)
Bias
RMS
Min
Max
6g - OSU91A
-6.01
21.13
-101.19
93.86
6g - DQM94(1)
-5.61
13.03
-81.14
45.58
6g - DQM94(2)
-5.35
10.66
-66.51
35.15
6g - DQM94(3)
-5.16
9.65
-60.07
32.32
6g - DQM94( 4)
-5.01
9.09
-54.99
31.13
6g - DQM94( 5)
-4.90
8.71
-50.79
30.38
6g - DQM94(6)
-4.79
8.44
-47.15
29.81
6g - DQM94(7)
-4.70
8.23
-43.98
29.36
6g - DQM94( 8)
-4.62
8.05
-41.21
29.01
It is clear from this that the RMS fit of the model shows a very
dramatic improvement, changing from ± 21 mGal to ± 13 mGal in the first
interation. But as a result of using the weight function Pn to taper
off the low coefficient changes, the rate of convergence of the whole
process was reduced. In total, 8 interations were performed for the
computation of the tailored model DQM94.
EVALUATION OF THE TAILORED MODEL DQM94
As a first test, the start model OSU91A and the tailored model DQM94
were compared with GPS and levelling results from the first order GPS
network of China. Geoid heights were computed from both start and
fitted models(NoRAv) at the 38 stations and compared against N values
found from GPS-derived ellipsoidal
heights and orthometric heights
from levelling, N OPS.
The results of these comparisons are summarized in Table 4. This
shows that the RMS discrepancy drops from 1. 11m for OSU91A to 1. 05m for
DQM94 and the bias decreases from -0.90 m to -0.10 m, thus proving a
significant improvement of the DQM94 model. This implies that the
change in N (.6N) inside the GPS network is found more accurately
using the fitted model. For many application of GPS levelling, this
parameter is the more significant and it appears that the fitted model
would be more suited to .6N evaluation in China.
Table 4.
Results of Comparisons of Geoid Height for China
GPS network (38 GPS stations)
Observed N (m)
Observed - OSU91A
Observed - DQM94
Bias
-23.099
-0.899
-0.101
RMS
34.936
1. 708
1.051
194
Max
25.442
2.129
2.480
Min
-63.998
-4.670
-2.310