

Table 2. Statistics Characterizing the Residual Anomalies ~6gE
and the Systematic Reductions (mGal)
Bias
RMS
Min
Max
~6gE
-6.007
21.128
-101.187
93.857
(IEh+IE y +IEp)
0.010
0.136
-0.468
0.544
~gh2
-0.122
0.411
-2.390
0.0
~gA
0.826
0.832
0.422
0.866
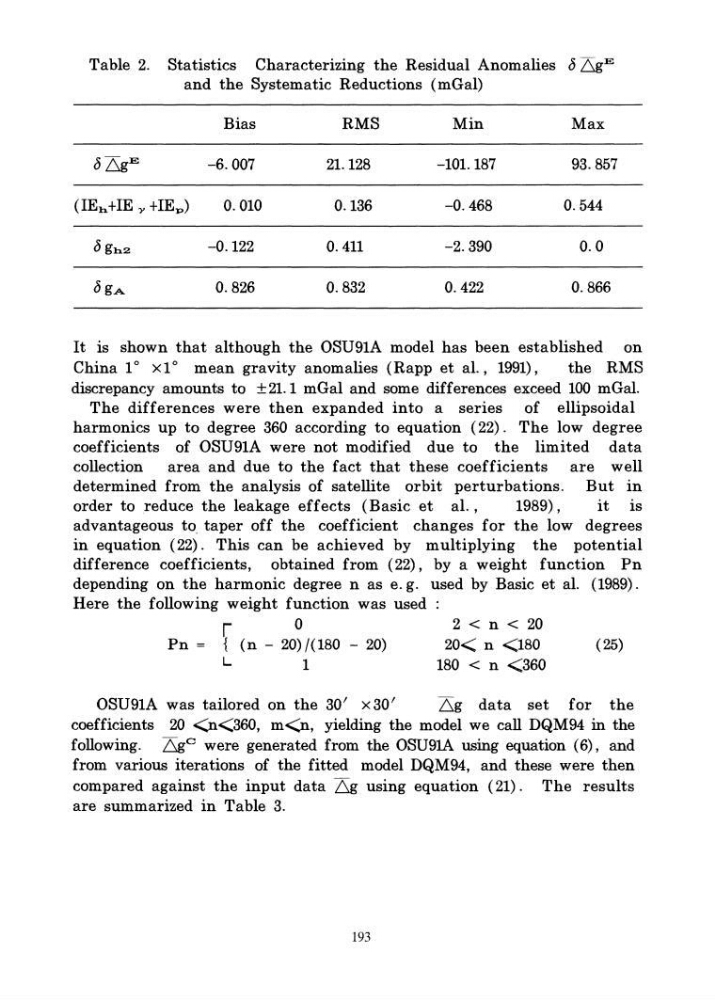
It is shown that although the OSU91A model has been established on
China 1
0
x1° mean gravity anomalies (Rapp et al., 1991),
the RMS
discrepancy amounts to ±21.1 mGal and some differences exceed 100 mGal.
The differences were then expanded into a series of ellipsoidal
harmonics up to degree 360 according to equation (22). The low degree
coefficients of OSU91A were not modified due to the limited data
collection area and due to the fact that these coefficients are well
determined from the analysis of satellite orbit perturbations. But in
order to reduce the leakage effects (Basic et aI.,
1989),
it IS
advantageous to, taper off the coefficient changes for the low degrees
in equation (22). This can be achieved by multiplying the potential
difference coefficients, obtained from (22), by a weight function Pn
depending on the harmonic degree n as e. g. used by Basic et al. (1989).
Here the following weight function was used
r
0
Pn = { (n - 20) /(180 - 20)
L
1
2
180 < n <360
(25)
OSU91A was tailored on the 30' x30'
~g data set for the
coefficients 20 <0<360, m
from various iterations of the fitted model DQM94, and these were then
compared against the input data 6g using equation (21). The results
are summarized in Table 3.
193
and the Systematic Reductions (mGal)
Bias
RMS
Min
Max
~6gE
-6.007
21.128
-101.187
93.857
(IEh+IE y +IEp)
0.010
0.136
-0.468
0.544
~gh2
-0.122
0.411
-2.390
0.0
~gA
0.826
0.832
0.422
0.866
It is shown that although the OSU91A model has been established on
China 1
0
x1° mean gravity anomalies (Rapp et al., 1991),
the RMS
discrepancy amounts to ±21.1 mGal and some differences exceed 100 mGal.
The differences were then expanded into a series of ellipsoidal
harmonics up to degree 360 according to equation (22). The low degree
coefficients of OSU91A were not modified due to the limited data
collection area and due to the fact that these coefficients are well
determined from the analysis of satellite orbit perturbations. But in
order to reduce the leakage effects (Basic et aI.,
1989),
it IS
advantageous to, taper off the coefficient changes for the low degrees
in equation (22). This can be achieved by multiplying the potential
difference coefficients, obtained from (22), by a weight function Pn
depending on the harmonic degree n as e. g. used by Basic et al. (1989).
Here the following weight function was used
r
0
Pn = { (n - 20) /(180 - 20)
L
1
2
180 < n <360
(25)
OSU91A was tailored on the 30' x30'
~g data set for the
coefficients 20 <0<360, m
from various iterations of the fitted model DQM94, and these were then
compared against the input data 6g using equation (21). The results
are summarized in Table 3.
193