

The following procedure, which was already applied In Weber and
Zomorrodian (1988), was chosen to compute 30' x 30' mean free-air
anomalies from the point gravity data:
- computation of more than 200, 000 point free-air
anomalies by
introducing normal gravity defined by the Geodetic Reference System
1980 (GRS80) and the free-air reduction from observed elevations;
- reduction of the Bouguer plate effect using observed elevations in
order to
obtain simple Bouguer anomalies showing smoother
characteristics due to the omitted attractions resulting from the
topography;
- interpolation of a regular mean Bouguer anomaly grid with 5' x5'
block size by means of mean process, which takes into account both
distances and directions of the observed points to the centre of the
cell for the selection of the observations;
- restitution of the Bouguer plate effect using 5' x5'
mean
elevations in order to obtain 5' x5'
mean free-air anomalies;
- determination of 6841 30' x30'
mean free-air anomalies by
averaging the values of 5' x5'
sub-blocks; derived block means were
not accepted in those cases where insufficient sub-block occupations or
its estimated error exceeding 20 mGal occurred. Taking into account
the errors in observation, interpolation and representation, their
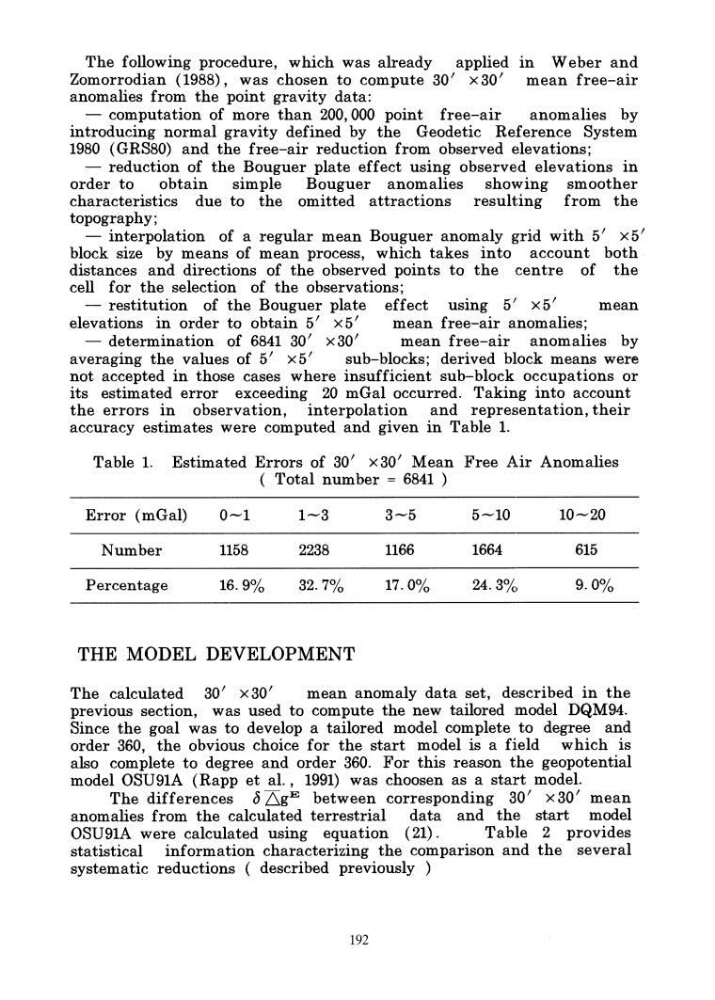
accuracy estimates were computed and given in Table 1.
Table 1. Estimated Errors of 30' x30' Mean Free Air Anomalies
( Total number = 6841 )
Error (mGal)
0-1
1-3
3-5
5-10
10-20
Number
1158
2238
1166
1664
615
Percentage
16.9%
32.7%
17.0%
24.3%
9.0%
THE MODEL DEVELOPMENT
The calculated 30' x30'
mean anomaly data set, described in the
previous section, was used to compute the new tailored model DQM94.
Since the goal was to develop a tailored model complete to degree and
order 360, the obvious choice for the start model is a field which is
also complete to degree and order 360. For this reason the geopotential
model OSU91A (Rapp et al., 1991) was choosen as a start model.
The differences ~ 6g E between corresponding 30' x30' mean
anomalies from the calculated terrestrial data and the start model
OSU91A were calculated using equation (21).
Table 2 provides
statistical information characterizing the comparison and the several
systematic reductions ( described previously )
192
Zomorrodian (1988), was chosen to compute 30' x 30' mean free-air
anomalies from the point gravity data:
- computation of more than 200, 000 point free-air
anomalies by
introducing normal gravity defined by the Geodetic Reference System
1980 (GRS80) and the free-air reduction from observed elevations;
- reduction of the Bouguer plate effect using observed elevations in
order to
obtain simple Bouguer anomalies showing smoother
characteristics due to the omitted attractions resulting from the
topography;
- interpolation of a regular mean Bouguer anomaly grid with 5' x5'
block size by means of mean process, which takes into account both
distances and directions of the observed points to the centre of the
cell for the selection of the observations;
- restitution of the Bouguer plate effect using 5' x5'
mean
elevations in order to obtain 5' x5'
mean free-air anomalies;
- determination of 6841 30' x30'
mean free-air anomalies by
averaging the values of 5' x5'
sub-blocks; derived block means were
not accepted in those cases where insufficient sub-block occupations or
its estimated error exceeding 20 mGal occurred. Taking into account
the errors in observation, interpolation and representation, their
accuracy estimates were computed and given in Table 1.
Table 1. Estimated Errors of 30' x30' Mean Free Air Anomalies
( Total number = 6841 )
Error (mGal)
0-1
1-3
3-5
5-10
10-20
Number
1158
2238
1166
1664
615
Percentage
16.9%
32.7%
17.0%
24.3%
9.0%
THE MODEL DEVELOPMENT
The calculated 30' x30'
mean anomaly data set, described in the
previous section, was used to compute the new tailored model DQM94.
Since the goal was to develop a tailored model complete to degree and
order 360, the obvious choice for the start model is a field which is
also complete to degree and order 360. For this reason the geopotential
model OSU91A (Rapp et al., 1991) was choosen as a start model.
The differences ~ 6g E between corresponding 30' x30' mean
anomalies from the calculated terrestrial data and the start model
OSU91A were calculated using equation (21).
Table 2 provides
statistical information characterizing the comparison and the several
systematic reductions ( described previously )
192