

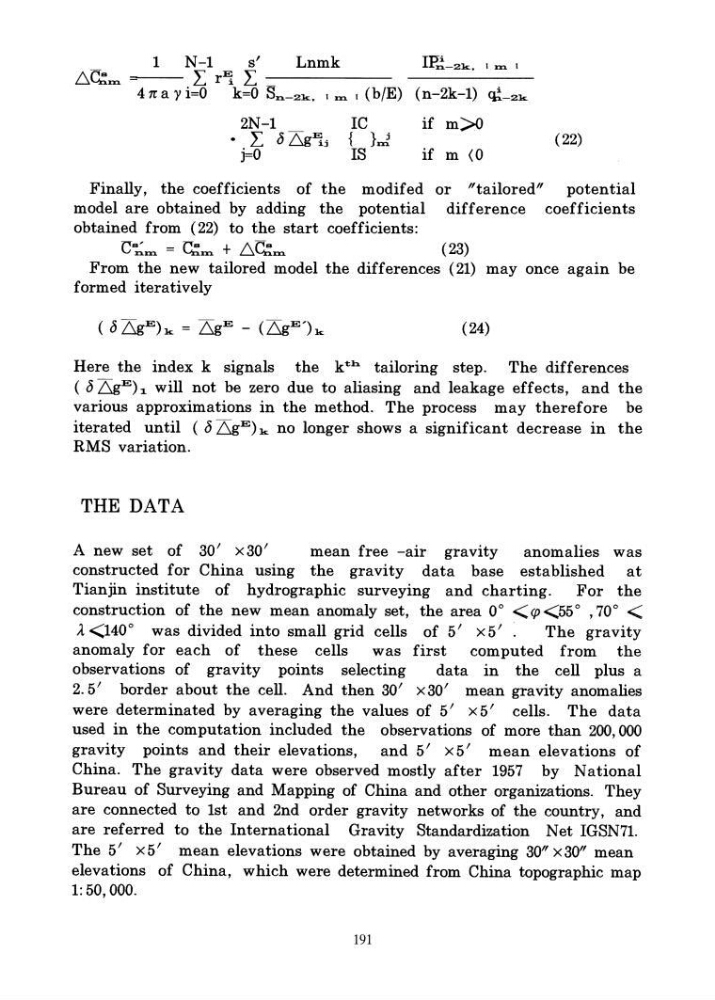
1 N-1
s'
Lnmk
IP~_2k. I :ttl. I
!:J.C::ttI.
L r~ L_
41t a y i=O
k=O Sn.-2k. I :ttl. I (b/E) (n-2k-1)
IC
if m>O
• L ~ !:J.g~j { }~
(22)
j=0
IS
if m (0
Finally, the coefficients of the modifed
model are obtained by adding the potential
obtained from (22) to the start coefficients:
or "tailored" poten tial
diff erence coefficien ts
C~:ttI. = ~:ttI. + !:J.C::ttI.
(23)
From the new tailored model the differences (21) may once agaIn be
formed iteratively
(24)
Here the index k signals the kth. tailoring step. The differences
( ~ !:J.gE)1 will not be zero due to aliasing and leakage effects, and the
various approximations in the method. The process may therefore be
iterated until (~!:J.gE) k no longer shows a significant decrease in the
RMS variation.
THE DATA
A new set of 30' x30'
mean free -air gravity
anomalies was
constructed for China using the gravity data base established at
Tianjin institute of hydrographic surveying and charting.
For the
construction of the new mean anomaly set, the area 0° <1])<55° ,70° <
A. <140° was divided into small grid cells of 5' x5'.
The gravity
anomaly for each of these cells was first computed from the
observations of gravity points selecting
data in the cell plus a
2.5' border about the cell. And then 30' x30' mean gravity anomalies
were determinated by averaging the values of 5' x5' cells. The data
used in the computation included the observations of more than 200,000
gravity points and their elevations, and 5' x5' mean elevations of
China. The gravity data were observed mostly after 1957 by National
Bureau of Surveying and Mapping of China and other organizations. They
are connected to 1st and 2nd order gravity networks of the country, and
are referred to the International Gravity Standardization Net IGSN71.
The 5' x5' mean elevations were obtained by averaging 30" x 30" mean
elevations of China, which were determined from China topographic map
1: 50, 000.
191
s'
Lnmk
IP~_2k. I :ttl. I
!:J.C::ttI.
L r~ L_
41t a y i=O
k=O Sn.-2k. I :ttl. I (b/E) (n-2k-1)
IC
if m>O
• L ~ !:J.g~j { }~
(22)
j=0
IS
if m (0
Finally, the coefficients of the modifed
model are obtained by adding the potential
obtained from (22) to the start coefficients:
or "tailored" poten tial
diff erence coefficien ts
C~:ttI. = ~:ttI. + !:J.C::ttI.
(23)
From the new tailored model the differences (21) may once agaIn be
formed iteratively
(24)
Here the index k signals the kth. tailoring step. The differences
( ~ !:J.gE)1 will not be zero due to aliasing and leakage effects, and the
various approximations in the method. The process may therefore be
iterated until (~!:J.gE) k no longer shows a significant decrease in the
RMS variation.
THE DATA
A new set of 30' x30'
mean free -air gravity
anomalies was
constructed for China using the gravity data base established at
Tianjin institute of hydrographic surveying and charting.
For the
construction of the new mean anomaly set, the area 0° <1])<55° ,70° <
A. <140° was divided into small grid cells of 5' x5'.
The gravity
anomaly for each of these cells was first computed from the
observations of gravity points selecting
data in the cell plus a
2.5' border about the cell. And then 30' x30' mean gravity anomalies
were determinated by averaging the values of 5' x5' cells. The data
used in the computation included the observations of more than 200,000
gravity points and their elevations, and 5' x5' mean elevations of
China. The gravity data were observed mostly after 1957 by National
Bureau of Surveying and Mapping of China and other organizations. They
are connected to 1st and 2nd order gravity networks of the country, and
are referred to the International Gravity Standardization Net IGSN71.
The 5' x5' mean elevations were obtained by averaging 30" x 30" mean
elevations of China, which were determined from China topographic map
1: 50, 000.
191