

respectively. These biases represent the JGM-2 standard deviations (ej) for the reference
values of 14 and 15 that are used in the dynamical model.
c:
.g ,-. 4.0E-12 .-----------=:-----.......---- - -- - - - - -- - --...,.. (a-:--1 )
.~ ... ",
--Smooth Interpolation
Cl ], 2.0E-12
0 Actual 15 Day Estimates
"ii (;
"8 6h O.OE+OO
~ en -2.0E-12 '"-_ ......... _--' _ _ -'--_--'-_---''--_....I...-_--'-_ _ '--_.....I..-_---'-_ _ ..I....--=......J
o
2
3
4
5
6
7
8
9
10
11
12
Months Past 1 January 1986
c:
6 OE_IO-- Smooth Interpolation
0
·0
.
0 Actual I Month Estimates
<'3
.~ til 3.0E-10
o 6h O.OE+OO
Q)(i5
"8 -3.0E-1O
~
-6.0E-1O
N
-,
0
3
6
9
12
Months Past 1 January 1986
c:
.g
I.5E-09 .------~---- --,
~~LOE-®~-_
~ en 5.0E- IO L
~ O.OE+OO
[ ~
-,
o
3
6
9
12
Month Past 1 January 1986
c:
0
6.0E-10
·0
<'3
.~ til 3.0E- 10
o c:
Q) ~ O.OE+OO
"8 -3.0E- 1O
~
-6.0E-10
~
.....
0
3
6
9
12
Months Past 1 January 1986
:i 8.0E_IO~
t til 6.0E-10
o 6h 4.0E-10
~ (i5 2.0E-1O
~
OOE+OO
e
.,
.
.....
o
3
6
9
12
Month Past 1 January 1986
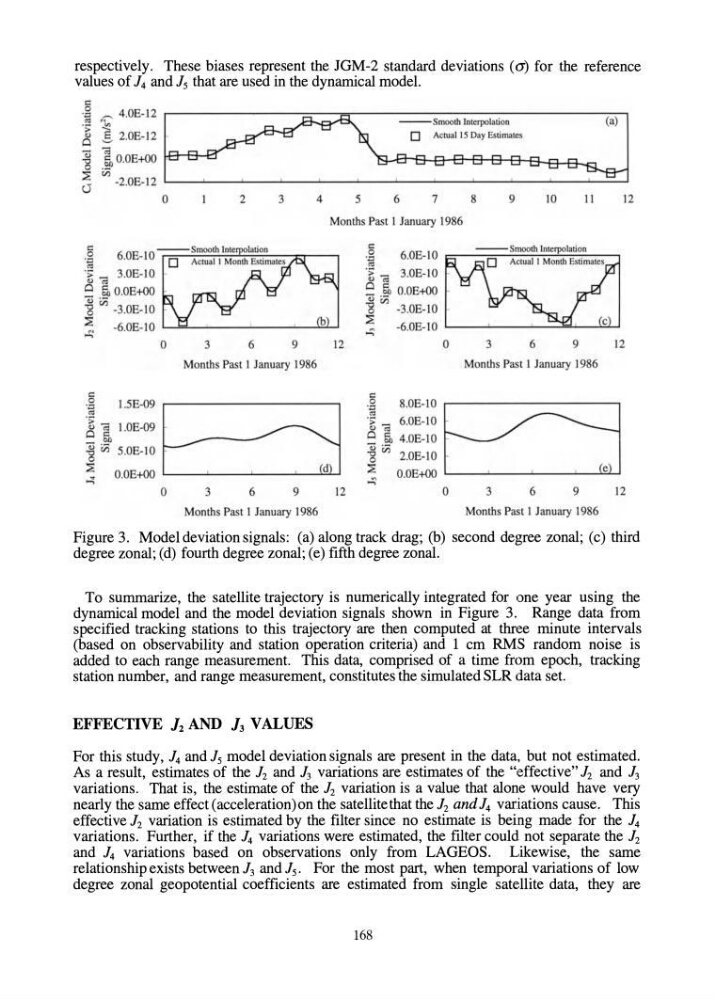
Figure 3. Model deviation signals: (a) along track drag; (b) second degree zonal; (c) third
degree zonal; (d) fourth degree zonal; (e) fifth degree zonal.
To summarize, the satellite trajectory is numerically integrated for one year using the
dynamical model and the model deviation signals shown in Figure 3. Range data from
specified tracking stations to this trajectory are then computed at three minute intervals
(based on observability and station operation criteria) and 1 cm RMS random noise is
added to each range measurement. This data, comprised of a time from epoch, tracking
station number, and range measurement, constitutes the simulated SLR data set.
EFFECTIVE 12 AND 13 VALVES
For this study, 14 and 15 model deviation signals are present in the data, but not estimated.
As a result, estimates of the 12 and 13 variations are estimates of the "effective" 12 and 13
variations. That is, the estimate of the 12 variation is a value that alone would have very
nearly the same effect (acceleration) on the satellite that the 12 and 14 var:iations cause. Tills
effective 12 variation is estimated by the filter since no estimate is being made for the 14
variations. Further, if the 14 variations were estimated, the filter could not separate the 12
and 14 variations based on observations only from LAGEOS. Likewise, the same
relationship exists between 13 and 1 5 , For the most part, when temporal variations of low
degree zonal geopotential coefficients are estimated from single satellite data, they are
168
values of 14 and 15 that are used in the dynamical model.
c:
.g ,-. 4.0E-12 .-----------=:-----.......---- - -- - - - - -- - --...,.. (a-:--1 )
.~ ... ",
--Smooth Interpolation
Cl ], 2.0E-12
0 Actual 15 Day Estimates
"ii (;
"8 6h O.OE+OO
~ en -2.0E-12 '"-_ ......... _--' _ _ -'--_--'-_---''--_....I...-_--'-_ _ '--_.....I..-_---'-_ _ ..I....--=......J
o
2
3
4
5
6
7
8
9
10
11
12
Months Past 1 January 1986
c:
6 OE_IO-- Smooth Interpolation
0
·0
.
0 Actual I Month Estimates
<'3
.~ til 3.0E-10
o 6h O.OE+OO
Q)(i5
"8 -3.0E-1O
~
-6.0E-1O
N
-,
0
3
6
9
12
Months Past 1 January 1986
c:
.g
I.5E-09 .------~---- --,
~~LOE-®~-_
~ en 5.0E- IO L
~ O.OE+OO
[ ~
-,
o
3
6
9
12
Month Past 1 January 1986
c:
0
6.0E-10
·0
<'3
.~ til 3.0E- 10
o c:
Q) ~ O.OE+OO
"8 -3.0E- 1O
~
-6.0E-10
~
.....
0
3
6
9
12
Months Past 1 January 1986
:i 8.0E_IO~
t til 6.0E-10
o 6h 4.0E-10
~ (i5 2.0E-1O
~
OOE+OO
e
.,
.
.....
o
3
6
9
12
Month Past 1 January 1986
Figure 3. Model deviation signals: (a) along track drag; (b) second degree zonal; (c) third
degree zonal; (d) fourth degree zonal; (e) fifth degree zonal.
To summarize, the satellite trajectory is numerically integrated for one year using the
dynamical model and the model deviation signals shown in Figure 3. Range data from
specified tracking stations to this trajectory are then computed at three minute intervals
(based on observability and station operation criteria) and 1 cm RMS random noise is
added to each range measurement. This data, comprised of a time from epoch, tracking
station number, and range measurement, constitutes the simulated SLR data set.
EFFECTIVE 12 AND 13 VALVES
For this study, 14 and 15 model deviation signals are present in the data, but not estimated.
As a result, estimates of the 12 and 13 variations are estimates of the "effective" 12 and 13
variations. That is, the estimate of the 12 variation is a value that alone would have very
nearly the same effect (acceleration) on the satellite that the 12 and 14 var:iations cause. Tills
effective 12 variation is estimated by the filter since no estimate is being made for the 14
variations. Further, if the 14 variations were estimated, the filter could not separate the 12
and 14 variations based on observations only from LAGEOS. Likewise, the same
relationship exists between 13 and 1 5 , For the most part, when temporal variations of low
degree zonal geopotential coefficients are estimated from single satellite data, they are
168