

254
Land-Ocean Systems in the Siberian Arctic: Dynamics and History
73' 30' N
72' OO' N
3a
9a
Sa
lOa
4a
6a 3a
9a
Sa
lOa
4a
sa
Ice
-5
-0.\
-0.\
.G.5.().a
E
-' .0
-5 -10
-1 . ,
a.
~
-15
-20
3a
9a
Sa
loa 4a
sa 3a
9a
Sa
loa
4a
sa
Ic.
-5
- -at. ~
-
66"
I
111
E
74
.,
5 -10
,..,
""
....
"CO
a.
c!:
-15
-20
0
20
40
60
80
0
20
40
60
80
Distance, km
Distance, km
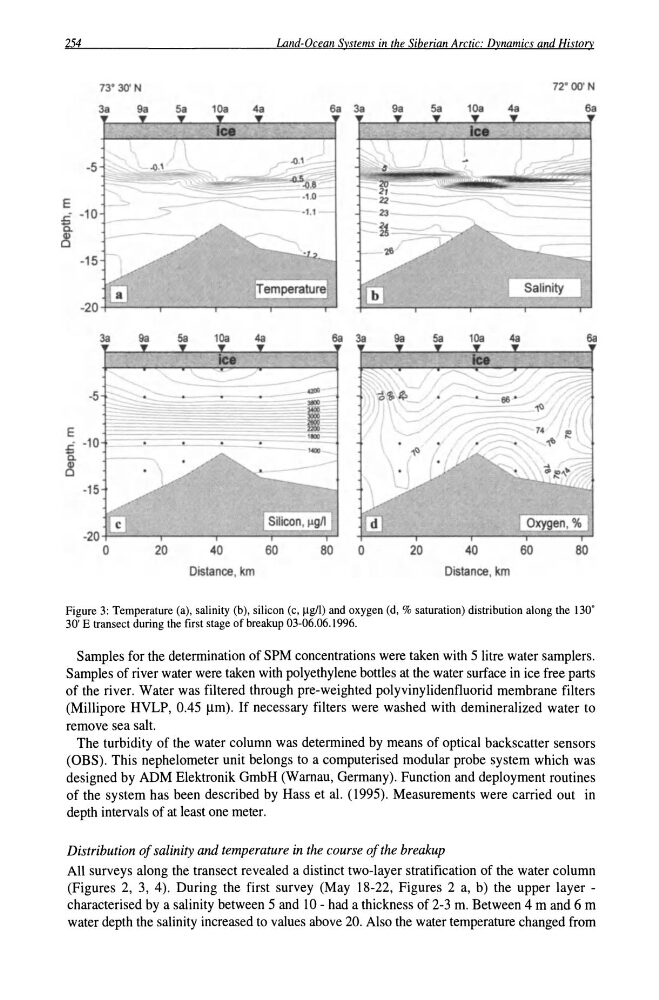
Figure 3: Temperature (a), salinity (b), silicon (c, ~g/l) and oxygen (d, % saturation) distribution along the 130°
30' E transect during the first stage of breakup 03-06.06.1996.
Samples for the detennination of SPM concentrations were taken with 5 litre water samplers.
Samples of river water were taken with polyethylene bottles at the water surface in ice free parts
of the river. Water was filtered through pre-weighted polyvinylidenfluorid membrane filters
(Millipore HVLP, 0.45 Ilm). If necessary filters were washed with demineralized water to
remove sea salt.
The turbidity of the water column was detennined by means of optical backscatter sensors
(OBS). This nephelometer unit belongs to a computerised modular probe system which was
designed by ADM Elektronik GmbH (Warnau, Germany). Function and deployment routines
of the system has been described by Hass et al. (1995). Measurements were carried out in
depth intervals of at least one meter.
Distribution of salinity and temperature in the course of the breakup
All surveys along the transect revealed a distinct two-layer stratification of the water column
(Figures 2, 3, 4). During the first survey (May 18-22, Figures 2 a, b) the upper layer -
characterised by a salinity between 5 and 10 - had a thickness of 2-3 m. Between 4 m and 6 m
water depth the salinity increased to values above 20. Also the water temperature changed from
Land-Ocean Systems in the Siberian Arctic: Dynamics and History
73' 30' N
72' OO' N
3a
9a
Sa
lOa
4a
6a 3a
9a
Sa
lOa
4a
sa
Ice
-5
-0.\
-0.\
.G.5.().a
E
-' .0
-5 -10
-1 . ,
a.
~
-15
-20
3a
9a
Sa
loa 4a
sa 3a
9a
Sa
loa
4a
sa
Ic.
-5
- -at. ~
-
66"
I
111
E
74
.,
5 -10
,..,
""
....
"CO
a.
c!:
-15
-20
0
20
40
60
80
0
20
40
60
80
Distance, km
Distance, km
Figure 3: Temperature (a), salinity (b), silicon (c, ~g/l) and oxygen (d, % saturation) distribution along the 130°
30' E transect during the first stage of breakup 03-06.06.1996.
Samples for the detennination of SPM concentrations were taken with 5 litre water samplers.
Samples of river water were taken with polyethylene bottles at the water surface in ice free parts
of the river. Water was filtered through pre-weighted polyvinylidenfluorid membrane filters
(Millipore HVLP, 0.45 Ilm). If necessary filters were washed with demineralized water to
remove sea salt.
The turbidity of the water column was detennined by means of optical backscatter sensors
(OBS). This nephelometer unit belongs to a computerised modular probe system which was
designed by ADM Elektronik GmbH (Warnau, Germany). Function and deployment routines
of the system has been described by Hass et al. (1995). Measurements were carried out in
depth intervals of at least one meter.
Distribution of salinity and temperature in the course of the breakup
All surveys along the transect revealed a distinct two-layer stratification of the water column
(Figures 2, 3, 4). During the first survey (May 18-22, Figures 2 a, b) the upper layer -
characterised by a salinity between 5 and 10 - had a thickness of 2-3 m. Between 4 m and 6 m
water depth the salinity increased to values above 20. Also the water temperature changed from