

Pivovarov et al.: Dissolved Oxygen. Silicon Phosvhorous and Suspended Matter Concentrations
-5
E
.£ -10
a.
~
-15
73' 30' N
3
9
5
10
4
6
3
:if
-1 .1
-20 ~L--r-_---"'_-=:;::::::=~
3
-5
E
-5
-1 0
0.
III
0
-15
-20
0
20
40
Distance, km
60
6
3
I ' lOll
'''''
80
o
9
5
22
9
5
20
10
10
40
Distance, km
4
4
60
253
72' 00' N
6
6
80
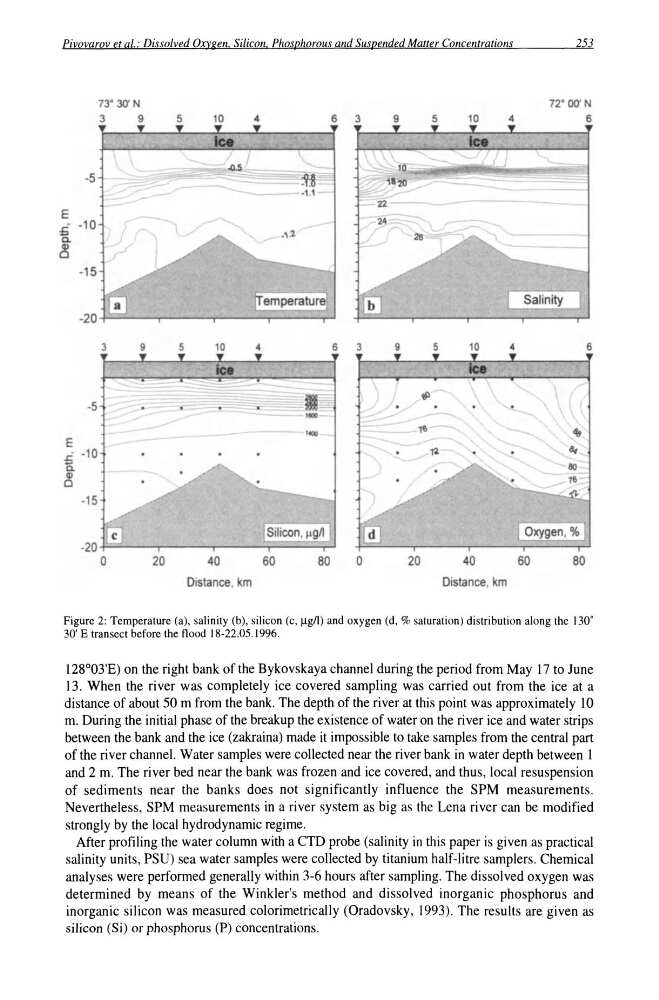
Figure 2: Temperature (a), salinity (b), silicon (c, Jlg/l) and oxygen (d, % saturation) distribution along the 130'
30' E transect before the flood 18-22.05.1996.
128°03'E) on the right bank of the Bykovskaya channel during the period from May 17 to June
13. When the river was completely ice covered sampling was carried out from the ice at a
distance of about 50 m from the bank. The depth of the river at this point was approximately 10
m. During the initial phase of the breakup the existence of water on the river ice and water strips
between the bank and the ice (zakraina) made it impossible to take samples from the central part
of the river channel. Water samples were collected near the river bank in water depth between 1
and 2 m. The river bed near the bank was frozen and ice covered, and thus, local resuspension
of sediments near the banks does not significantly influence the SPM measurements.
Nevertheless, SPM measurements in a river system as big as the Lena river can be modified
strongly by the local hydrodynamic regime.
After profiling the water column with a CTD probe (salinity in this paper is given as practical
salinity units, PSU) sea water samples were collected by titanium half-litre samplers. Chemical
analyses were performed generally within 3-6 hours after sampling. The dissolved oxygen was
determined by means of the Winkler's method and dissolved inorganic phosphorus and
inorganic silicon was measured colorimetrically (Oradovsky, 1993). The results are given as
silicon (Si) or phosphorus (P) concentrations.
-5
E
.£ -10
a.
~
-15
73' 30' N
3
9
5
10
4
6
3
:if
-1 .1
-20 ~L--r-_---"'_-=:;::::::=~
3
-5
E
-5
-1 0
0.
III
0
-15
-20
0
20
40
Distance, km
60
6
3
I ' lOll
'''''
80
o
9
5
22
9
5
20
10
10
40
Distance, km
4
4
60
253
72' 00' N
6
6
80
Figure 2: Temperature (a), salinity (b), silicon (c, Jlg/l) and oxygen (d, % saturation) distribution along the 130'
30' E transect before the flood 18-22.05.1996.
128°03'E) on the right bank of the Bykovskaya channel during the period from May 17 to June
13. When the river was completely ice covered sampling was carried out from the ice at a
distance of about 50 m from the bank. The depth of the river at this point was approximately 10
m. During the initial phase of the breakup the existence of water on the river ice and water strips
between the bank and the ice (zakraina) made it impossible to take samples from the central part
of the river channel. Water samples were collected near the river bank in water depth between 1
and 2 m. The river bed near the bank was frozen and ice covered, and thus, local resuspension
of sediments near the banks does not significantly influence the SPM measurements.
Nevertheless, SPM measurements in a river system as big as the Lena river can be modified
strongly by the local hydrodynamic regime.
After profiling the water column with a CTD probe (salinity in this paper is given as practical
salinity units, PSU) sea water samples were collected by titanium half-litre samplers. Chemical
analyses were performed generally within 3-6 hours after sampling. The dissolved oxygen was
determined by means of the Winkler's method and dissolved inorganic phosphorus and
inorganic silicon was measured colorimetrically (Oradovsky, 1993). The results are given as
silicon (Si) or phosphorus (P) concentrations.