

Pivovarov et al.,' Dissolved Oxygen. Silicon. Phosohorous and Suspended Matter Concentratiolls
73' 30' N
3b
9b
5b
-5
E
:; ·10
Q.
~
-15
3b
9b
5b
·5
E
.s= ·10
a 011
'~ .
0
·15
·20
0
20
10b
4b
6b 3b
lOb
4b
6b 3b
-
- ....
I~
40
60
80
0
Distance, km
9b
5b
9b
5b
20
lOb
4b
lOb
4b
40
Distance, km
255
72' 00' N
6b
6b
60
80
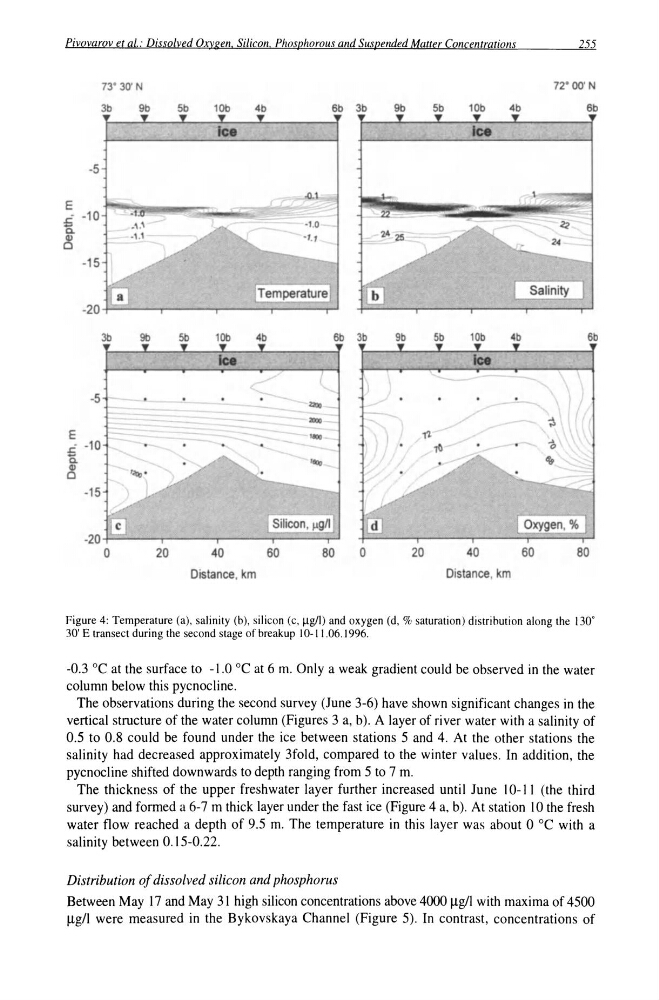
Figure 4: Temperature (a), salinity (b), silicon (c, ~gll) and oxygen (d, % saturation) distribution along the 130'
30' E transect during the second stage of breakup 10-11 .06.1996.
-0.3 °C at the surface to -1.0 °C at 6 m. Only a weak gradient could be observed in the water
column below this pycnocline.
The observations during the second survey (June 3-6) have shown significant changes in the
vertical structure of the water column (Figures 3 a, b). A layer of river water with a salinity of
0.5 to 0.8 could be found under the ice between stations 5 and 4. At the other stations the
salinity had decreased approximately 3fold, compared to the winter values. In addition, the
pycnocline shifted downwards to depth ranging from 5 to 7 m.
The thickness of the upper freshwater layer further increased until June 10-11 (the third
survey) and formed a 6-7 m thick layer under the fast ice (Figure 4 a, b). At station 10 the fresh
water flow reached a depth of 9.5 m. The temperature in this layer was about 0 °C with a
salinity between 0.15-0.22.
Distribution of dissolved silicon and phosphorus
Between May 17 and May 31 high silicon concentrations above 4000 Ilg/1 with maxima of 4500
Ilg/l were measured in the Bykovskaya Channel (Figure 5). In contrast, concentrations of
73' 30' N
3b
9b
5b
-5
E
:; ·10
Q.
~
-15
3b
9b
5b
·5
E
.s= ·10
a 011
'~ .
0
·15
·20
0
20
10b
4b
6b 3b
lOb
4b
6b 3b
-
- ....
I~
40
60
80
0
Distance, km
9b
5b
9b
5b
20
lOb
4b
lOb
4b
40
Distance, km
255
72' 00' N
6b
6b
60
80
Figure 4: Temperature (a), salinity (b), silicon (c, ~gll) and oxygen (d, % saturation) distribution along the 130'
30' E transect during the second stage of breakup 10-11 .06.1996.
-0.3 °C at the surface to -1.0 °C at 6 m. Only a weak gradient could be observed in the water
column below this pycnocline.
The observations during the second survey (June 3-6) have shown significant changes in the
vertical structure of the water column (Figures 3 a, b). A layer of river water with a salinity of
0.5 to 0.8 could be found under the ice between stations 5 and 4. At the other stations the
salinity had decreased approximately 3fold, compared to the winter values. In addition, the
pycnocline shifted downwards to depth ranging from 5 to 7 m.
The thickness of the upper freshwater layer further increased until June 10-11 (the third
survey) and formed a 6-7 m thick layer under the fast ice (Figure 4 a, b). At station 10 the fresh
water flow reached a depth of 9.5 m. The temperature in this layer was about 0 °C with a
salinity between 0.15-0.22.
Distribution of dissolved silicon and phosphorus
Between May 17 and May 31 high silicon concentrations above 4000 Ilg/1 with maxima of 4500
Ilg/l were measured in the Bykovskaya Channel (Figure 5). In contrast, concentrations of