

246
Land-Ocean Systems in the Siberian Arctic: Dynamics and History
the distribution of water and sediment load discharges relative to the expedition section located
3 km above the delta head near the Chersky settlement, rather than to the Kolymskoye section.
Unfortunately, limited runoff observations at this section do not permit obtaining seasonal and
multiyear parameters. Most expedition measurements of the runoff in the Kolyma delta were
made by the All-Union Arctic Institute in 1934, 1935 and 1937, the Arktikproject in 1953 and
1954 and the AARI in 1991. However, they were of occasional character covering only small
parts of some delta branches. The measurements were most numerous in the Kamennaya and
Lesnaya branches near the Krai Lesa settlement. At the other sections 1-2 discharges per section
were measured. A comparison of 1991 measurements in the delta branches with previous
measurements at close conditions of summer low water has shown the differences of up to
10%. This can be attributed to different observational methods or changes in the channel net of
the delta. Since the necessary measurements of water discharges of the Kolyma river at the
entrance to the delta were absent, the obtained data have not allowed a reliable determination of
the water content of the branches relative to the total river runoff. However, these data (except
for 1991) were used as initial data for the design and regulation of the aerodynamic model of
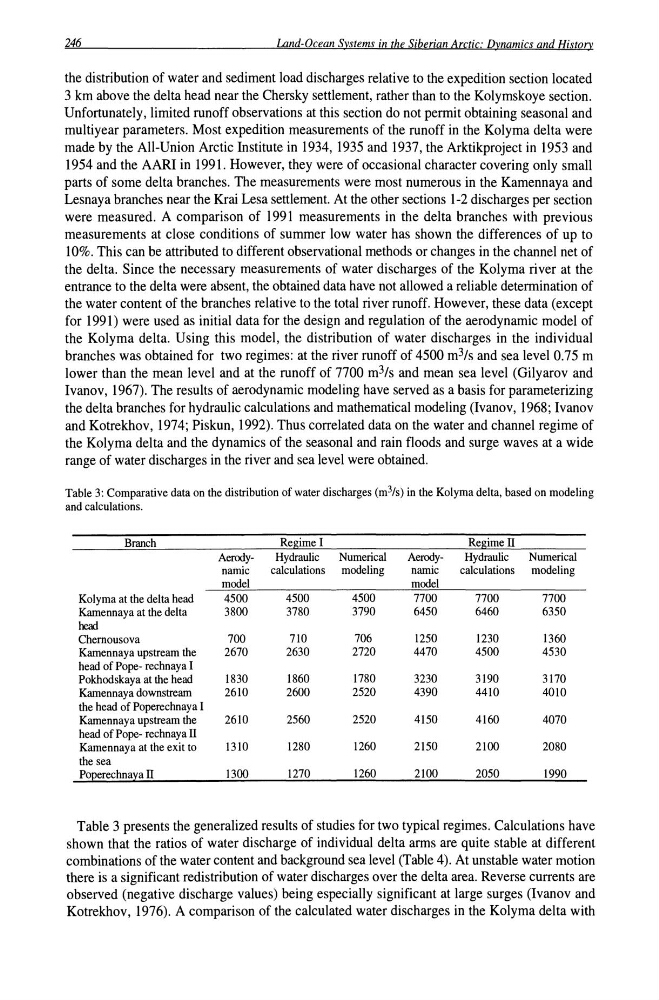
the Kolyma delta. Using this model, the distribution of water discharges in the individual
branches was obtained for two regimes: at the river runoff of 4500 m 3 /s and sea level 0.75 m
lower than the mean level and at the runoff of 7700 m 3 /s and mean sea level (Gilyarov and
Ivanov, 1967). The results of aerodynamic modeling have served as a basis for parameterizing
the delta branches for hydraulic calculations and mathematical modeling (Ivanov, 1968; Ivanov
and Kotrekhov, 1974; Piskun, 1992). Thus correlated data on the water and channel regime of
the Kolyma delta and the dynamics of the seasonal and rain floods and surge waves at a wide
range of water discharges in the river and sea level were obtained.
Table 3: Comparative data on the distribution of water discharges (m 3 /s) in the Kolyma delta, based on modeling
and calculations.
Branch
Regime I
Regime II
AerodyHydraulic
Numerical
AerodyHydraulic
Numerical
namic
calculations modeling
namic
calculations modeling
model
model
Kolyma at the delta head
4500
4500
4500
7700
7700
7700
Kamennaya at the delta
3800
3780
3790
6450
6460
6350
head
Chernousova
700
710
706
1250
1230
1360
Kamennaya upstream the
2670
2630
2720
4470
4500
4530
head of Pope- rechnaya I
Pokhodskaya at the head
1830
1860
1780
3230
3190
3170
Kamennaya downstream
2610
2600
2520
4390
4410
4010
the head of Poperechnaya I
Kamennaya upstream the
2610
2560
2520
4150
4160
4070
head of Pope- rechnaya II
Kamennaya at the exit to
1310
1280
1260
2150
2100
2080
the sea
POJ:!erechna:z:a II
1300
1270
1260
2100
2050
1990
Table 3 presents the generalized results of studies for two typical regimes. Calculations have
shown that the ratios of water discharge of individual delta arms are quite stable at different
combinations of the water content and background sea level (Table 4). At unstable water motion
there is a significant redistribution of water discharges over the delta area. Reverse currents are
observed (negative discharge values) being especially significant at large surges (Ivanov and
Kotrekhov, 1976). A comparison of the calculated water discharges in the Kolyma delta with
Land-Ocean Systems in the Siberian Arctic: Dynamics and History
the distribution of water and sediment load discharges relative to the expedition section located
3 km above the delta head near the Chersky settlement, rather than to the Kolymskoye section.
Unfortunately, limited runoff observations at this section do not permit obtaining seasonal and
multiyear parameters. Most expedition measurements of the runoff in the Kolyma delta were
made by the All-Union Arctic Institute in 1934, 1935 and 1937, the Arktikproject in 1953 and
1954 and the AARI in 1991. However, they were of occasional character covering only small
parts of some delta branches. The measurements were most numerous in the Kamennaya and
Lesnaya branches near the Krai Lesa settlement. At the other sections 1-2 discharges per section
were measured. A comparison of 1991 measurements in the delta branches with previous
measurements at close conditions of summer low water has shown the differences of up to
10%. This can be attributed to different observational methods or changes in the channel net of
the delta. Since the necessary measurements of water discharges of the Kolyma river at the
entrance to the delta were absent, the obtained data have not allowed a reliable determination of
the water content of the branches relative to the total river runoff. However, these data (except
for 1991) were used as initial data for the design and regulation of the aerodynamic model of
the Kolyma delta. Using this model, the distribution of water discharges in the individual
branches was obtained for two regimes: at the river runoff of 4500 m 3 /s and sea level 0.75 m
lower than the mean level and at the runoff of 7700 m 3 /s and mean sea level (Gilyarov and
Ivanov, 1967). The results of aerodynamic modeling have served as a basis for parameterizing
the delta branches for hydraulic calculations and mathematical modeling (Ivanov, 1968; Ivanov
and Kotrekhov, 1974; Piskun, 1992). Thus correlated data on the water and channel regime of
the Kolyma delta and the dynamics of the seasonal and rain floods and surge waves at a wide
range of water discharges in the river and sea level were obtained.
Table 3: Comparative data on the distribution of water discharges (m 3 /s) in the Kolyma delta, based on modeling
and calculations.
Branch
Regime I
Regime II
AerodyHydraulic
Numerical
AerodyHydraulic
Numerical
namic
calculations modeling
namic
calculations modeling
model
model
Kolyma at the delta head
4500
4500
4500
7700
7700
7700
Kamennaya at the delta
3800
3780
3790
6450
6460
6350
head
Chernousova
700
710
706
1250
1230
1360
Kamennaya upstream the
2670
2630
2720
4470
4500
4530
head of Pope- rechnaya I
Pokhodskaya at the head
1830
1860
1780
3230
3190
3170
Kamennaya downstream
2610
2600
2520
4390
4410
4010
the head of Poperechnaya I
Kamennaya upstream the
2610
2560
2520
4150
4160
4070
head of Pope- rechnaya II
Kamennaya at the exit to
1310
1280
1260
2150
2100
2080
the sea
POJ:!erechna:z:a II
1300
1270
1260
2100
2050
1990
Table 3 presents the generalized results of studies for two typical regimes. Calculations have
shown that the ratios of water discharge of individual delta arms are quite stable at different
combinations of the water content and background sea level (Table 4). At unstable water motion
there is a significant redistribution of water discharges over the delta area. Reverse currents are
observed (negative discharge values) being especially significant at large surges (Ivanov and
Kotrekhov, 1976). A comparison of the calculated water discharges in the Kolyma delta with