

JJ6
Land-Ocean Systems in the Siberian Arctic: Dynamics and History
80
76
~
III
U .
o
c
100
-; ,
S j b e r .
I a
100' E
120' E
140'
160'
Sea-ice concentration
31 Oct. 1995
140' E
Fast ice
4-6/10
7-9/ 10
72 N
160' E
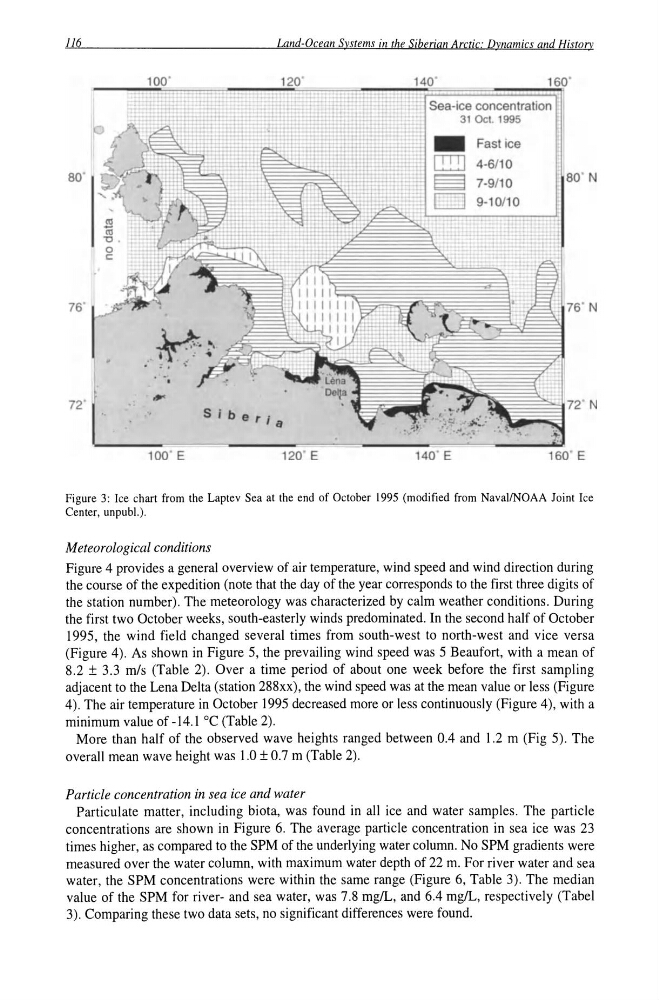
Figure 3: Ice chart from the Laptev Sea at the end of October 1995 (modified from NavalfNOAA Joint Ice
Center, unpubl.).
Meteorological conditions
Figure 4 provides a general overview of air temperature, wind speed and wind direction during
the course of the expedition (note that the day of the year corresponds to the first three digits of
the station number). The meteorology was characterized by calm weather conditions. During
the first two October weeks, south-easterly winds predominated. In the second half of October
1995, the wind field changed several times from south-west to north-west and vice versa
(Figure 4). As shown in Figure 5, the prevailing wind speed was 5 Beaufort, with a mean of
8.2 ± 3.3 mls (Table 2). Over a time period of about one week before the first sampling
adjacent to the Lena Delta (station 288xx), the wind speed was at the mean value or less (Figure
4). The air temperature in October 1995 decreased more or less continuously (Figure 4) , with a
minimum value of -14.1 °C (Table 2).
More than half of the observed wave heights ranged between 0.4 and 1.2 m (Fig 5). The
overall mean wave height was 1.0 ± 0.7 m (Table 2).
Particle concentration in sea ice and water
Particulate matter, including biota, was found in all ice and water samples. The particle
concentrations are shown in Figure 6. The average particle concentration in sea ice was 23
times higher, as compared to the SPM of the underlying water column. No SPM gradients were
measured over the water column, with maximum water depth of 22 m. For river water and sea
water, the SPM concentrations were within the same range (Figure 6, Table 3). The median
value of the SPM for river- and sea water, was 7.8 mg/L, and 6.4 mg/L, respectively (Tabel
3). Comparing these two data sets, no significant differences were found.
Land-Ocean Systems in the Siberian Arctic: Dynamics and History
80
76
~
III
U .
o
c
100
-; ,
S j b e r .
I a
100' E
120' E
140'
160'
Sea-ice concentration
31 Oct. 1995
140' E
Fast ice
4-6/10
7-9/ 10
72 N
160' E
Figure 3: Ice chart from the Laptev Sea at the end of October 1995 (modified from NavalfNOAA Joint Ice
Center, unpubl.).
Meteorological conditions
Figure 4 provides a general overview of air temperature, wind speed and wind direction during
the course of the expedition (note that the day of the year corresponds to the first three digits of
the station number). The meteorology was characterized by calm weather conditions. During
the first two October weeks, south-easterly winds predominated. In the second half of October
1995, the wind field changed several times from south-west to north-west and vice versa
(Figure 4). As shown in Figure 5, the prevailing wind speed was 5 Beaufort, with a mean of
8.2 ± 3.3 mls (Table 2). Over a time period of about one week before the first sampling
adjacent to the Lena Delta (station 288xx), the wind speed was at the mean value or less (Figure
4). The air temperature in October 1995 decreased more or less continuously (Figure 4) , with a
minimum value of -14.1 °C (Table 2).
More than half of the observed wave heights ranged between 0.4 and 1.2 m (Fig 5). The
overall mean wave height was 1.0 ± 0.7 m (Table 2).
Particle concentration in sea ice and water
Particulate matter, including biota, was found in all ice and water samples. The particle
concentrations are shown in Figure 6. The average particle concentration in sea ice was 23
times higher, as compared to the SPM of the underlying water column. No SPM gradients were
measured over the water column, with maximum water depth of 22 m. For river water and sea
water, the SPM concentrations were within the same range (Figure 6, Table 3). The median
value of the SPM for river- and sea water, was 7.8 mg/L, and 6.4 mg/L, respectively (Tabel
3). Comparing these two data sets, no significant differences were found.