

Hiilemann et at.: Dissolved and Particulate Maior and Trace Elements
105
strongly enriched in dissolved metals compared to concentrations observed in the water column
at the station and in the river water. Extremely strong enrichment of dissolved Fe, Mn, Cd and
Zn were only found in ice with high particle contents north off the Tumatskaya branch. New
and young ice from other regions show only moderate enrichments of Cd, Zn and Pb and low
concentrations of Fe, Mn, Cu and Ni.
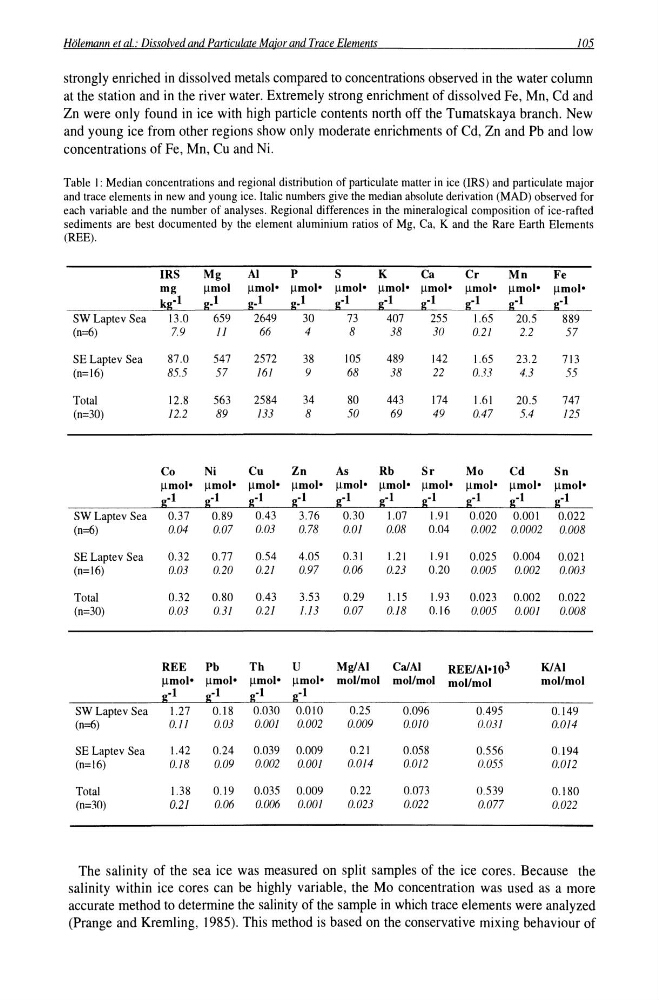
Table I: Median concentrations and regional distribution of particulate matter in ice (IRS) and particulate major
and trace elements in new and young ice. Italic numbers give the median absolute derivation (MAD) observed for
each variable and the number of analyses. Regional differences in the mineralogical composition of ice-rafted
sediments are best documented by the element aluminium ratios of Mg, Ca. K and the Rare Earth Elements
(REE).
IRS
Mg
Al
P
S
K
Ca
Cr
Mn
Fe
mg
~mol
~mol· ~mol·
~mol· ~mol· ~mol·
~mol· ~mol·
~mol·
kg-!
g_!
go!
go!
go!
go!
go!
go!
go!
go!
SW Laptev Sea
13.0
659
2649
30
73
407
255
1.65
20.5
889
(n=6)
7.9
11
66
4
8
38
30
021
2.2
57
SE Laptev Sea
87.0
547
2572
38
105
489
142
1.65
23.2
713
(n=16)
85.5
57
161
9
68
38
22
0.33
4.3
55
Total
12.8
563
2584
34
80
443
174
1.61
20.5
747
(n=30)
12.2
89
133
8
50
69
49
0.47
5.4
125
Co
Ni
Cu
Zn
As
Rb
Sr
Mo
Cd
Sn
~mol· ~mol· ~mol· ~mol· ~mol· ~mol· ~mol·
~mol· ~mol·
~mol·
go!
go!
go!
go!
go!
go!
go!
got
go!
go!
SW Laptev Sea
0.37
0.89
0.43
3.76
0.30
1.07
1.91
0.020 0.001
0.022
(n=6)
0.04
0.07
0.03
0.78
0.01
0.08
0.04
0.002 0.0002
0.008
SE Laptev Sea
0.32
0.77
0.54
4.05
0.31
1.21
1.91
0.025
0.004
0.021
(n=16)
OJ)3
0.20
0.21
0.97
0.06
0.23
0.20
0.005
0.002
OJ)03
Total
0.32
0.80
0.43
3.53
0.29
1.15
1.93
0.023
0.002
0.022
(n=30)
0.03
031
0.21
1.13
0.07
0.18
0.16
0.005
0.001
0.008
REE
Pb
Th
U
Mg/AI
Ca/AI
REE/AI·10 3
KlAI
~mol· ~mol· ~mol· ~mol·
mol/mol mol/mol mol/mol
mol/mol
go!
go!
go!
go!
SW Laptev Sea
1.27
0.18
0.030 0.010
0.25
0.096
0.495
0.149
(n=6)
0.11
0.03
0.001
0.002
0.009
O.O]()
IJ.031
O.OJ4
SE Laptev Sea
1.42
0.24
0.039 0.009
0.21
0.058
0.556
0.194
(n=16)
O.J8
0.09
0.002
0.001
0.014
OJm
0.055
0.012
Total
1.38
0.19
0.035
0.009
0.22
0.073
0.539
0.180
(n=30)
0.21
0.06
0.006
0.001
0.023
0.022
0.077
0.022
The salinity of the sea ice was measured on split samples of the ice cores. Because the
salinity within ice cores can be highly variable, the Mo concentration was used as a more
accurate method to determine the salinity of the sample in which trace elements were analyzed
(Prange and Kremling, \985). This method is based on the conservative mixing behaviour of
105
strongly enriched in dissolved metals compared to concentrations observed in the water column
at the station and in the river water. Extremely strong enrichment of dissolved Fe, Mn, Cd and
Zn were only found in ice with high particle contents north off the Tumatskaya branch. New
and young ice from other regions show only moderate enrichments of Cd, Zn and Pb and low
concentrations of Fe, Mn, Cu and Ni.
Table I: Median concentrations and regional distribution of particulate matter in ice (IRS) and particulate major
and trace elements in new and young ice. Italic numbers give the median absolute derivation (MAD) observed for
each variable and the number of analyses. Regional differences in the mineralogical composition of ice-rafted
sediments are best documented by the element aluminium ratios of Mg, Ca. K and the Rare Earth Elements
(REE).
IRS
Mg
Al
P
S
K
Ca
Cr
Mn
Fe
mg
~mol
~mol· ~mol·
~mol· ~mol· ~mol·
~mol· ~mol·
~mol·
kg-!
g_!
go!
go!
go!
go!
go!
go!
go!
go!
SW Laptev Sea
13.0
659
2649
30
73
407
255
1.65
20.5
889
(n=6)
7.9
11
66
4
8
38
30
021
2.2
57
SE Laptev Sea
87.0
547
2572
38
105
489
142
1.65
23.2
713
(n=16)
85.5
57
161
9
68
38
22
0.33
4.3
55
Total
12.8
563
2584
34
80
443
174
1.61
20.5
747
(n=30)
12.2
89
133
8
50
69
49
0.47
5.4
125
Co
Ni
Cu
Zn
As
Rb
Sr
Mo
Cd
Sn
~mol· ~mol· ~mol· ~mol· ~mol· ~mol· ~mol·
~mol· ~mol·
~mol·
go!
go!
go!
go!
go!
go!
go!
got
go!
go!
SW Laptev Sea
0.37
0.89
0.43
3.76
0.30
1.07
1.91
0.020 0.001
0.022
(n=6)
0.04
0.07
0.03
0.78
0.01
0.08
0.04
0.002 0.0002
0.008
SE Laptev Sea
0.32
0.77
0.54
4.05
0.31
1.21
1.91
0.025
0.004
0.021
(n=16)
OJ)3
0.20
0.21
0.97
0.06
0.23
0.20
0.005
0.002
OJ)03
Total
0.32
0.80
0.43
3.53
0.29
1.15
1.93
0.023
0.002
0.022
(n=30)
0.03
031
0.21
1.13
0.07
0.18
0.16
0.005
0.001
0.008
REE
Pb
Th
U
Mg/AI
Ca/AI
REE/AI·10 3
KlAI
~mol· ~mol· ~mol· ~mol·
mol/mol mol/mol mol/mol
mol/mol
go!
go!
go!
go!
SW Laptev Sea
1.27
0.18
0.030 0.010
0.25
0.096
0.495
0.149
(n=6)
0.11
0.03
0.001
0.002
0.009
O.O]()
IJ.031
O.OJ4
SE Laptev Sea
1.42
0.24
0.039 0.009
0.21
0.058
0.556
0.194
(n=16)
O.J8
0.09
0.002
0.001
0.014
OJm
0.055
0.012
Total
1.38
0.19
0.035
0.009
0.22
0.073
0.539
0.180
(n=30)
0.21
0.06
0.006
0.001
0.023
0.022
0.077
0.022
The salinity of the sea ice was measured on split samples of the ice cores. Because the
salinity within ice cores can be highly variable, the Mo concentration was used as a more
accurate method to determine the salinity of the sample in which trace elements were analyzed
(Prange and Kremling, \985). This method is based on the conservative mixing behaviour of