

106
Land-Ocean Systems in the Siberian Arctic: Dynamics and History
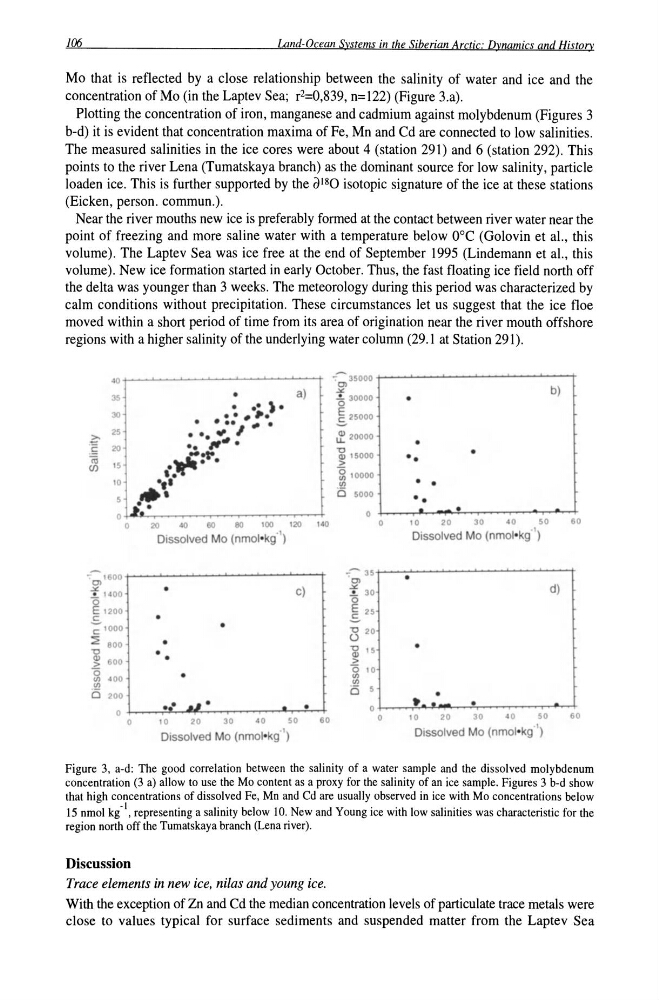
Mo that is reflected by a close relationship between the salinity of water and ice and the
concentration ofMo (in the Laptev Sea; r2=0,839, n=122) (Figure 3.a).
Plotting the concentration of iron, manganese and cadmium against molybdenum (Figures 3
b-d) it is evident that concentration maxima of Fe, Mn and Cd are connected to low salinities.
The measured salinities in the ice cores were about 4 (station 291) and 6 (station 292). This
points to the river Lena (Tumatskaya branch) as the dominant source for low salinity, particle
loaden ice. This is further supported by the a l8 0 isotopic signature of the ice at these stations
(Eicken, person. commun.).
Near the river mouths new ice is preferably formed at the contact between river water near the
point of freezing and more saline water with a temperature below O°C (Golovin et aI., this
volume). The Laptev Sea was ice free at the end of September 1995 (Lindemann et aI., this
volume). New ice formation started in early October. Thus, the fast floating ice field north off
the delta was younger than 3 weeks. The meteorology during this period was characterized by
calm conditions without precipitation. These circumstances let us suggest that the ice floe
moved within a short period of time from its area of origination near the river mouth offshore
regions with a higher salinity of the underlying water column (29.1 at Station 291).
01()
35000
C>
•
a)
.><
b)
35
'5 30000
•
• ..)1.
1 25000
30
•• • II.
•
• • •
fit·
25
••• '" I
.f 20000
z..
".,.
•
S 20
••
a; 15000
•
'iO
• ~:s-.
..
15
>
(/)
••
Si 10000
10
. "
III
• •
,.,
(5 5000
••
j .•
•
0
0
20
40
60
eo 100 120 140
0
10
20
30
4 0
50
60
Dissolved Mo (nmol-kg" )
Dissolved Mo (nmol-kg ' )
-- 35
--'600
C>
•
C>
•
oX
d)
f 1400
c)
-!.. 30
0
0
E 1200
E 25
C
.s
~ 1000
•
B 20
~ 800
•
'0 15
•
'0
•
Ql
Ql 600
•
>
>
'0
'0
'0
400
-
III
III
III
III
Ci 5
Ci 200
•
.. - ~" .
. •
0
• . •
0
0
10
20
30
40
50
60
0
10
20
30
40
50
60
Dissolved Mo (nmol-kg" )
Dissolved Mo (nmol-kg ')
Figure 3, a-d: The good correlation between the salinity of a water sample and the dissolved molybdenum
concentration (3 a) allow to use the Mo content as a proxy for the salinity of an ice sample. Figures 3 b-d show
that high concentrations of dissolved Fe, Mn and Cd are usually observed in ice with Mo concentrations below
15 nmol kg-I, representing a salinity below 10. New and Young ice with low salinities was characteristic for the
region north off the Tumatskaya branch (Lena river).
Discussion
Trace elements in new ice, nilas and young ice.
With the exception of Zn and Cd the median concentration levels of particulate trace metals were
close to values typical for surface sediments and suspended matter from the Laptev Sea
Land-Ocean Systems in the Siberian Arctic: Dynamics and History
Mo that is reflected by a close relationship between the salinity of water and ice and the
concentration ofMo (in the Laptev Sea; r2=0,839, n=122) (Figure 3.a).
Plotting the concentration of iron, manganese and cadmium against molybdenum (Figures 3
b-d) it is evident that concentration maxima of Fe, Mn and Cd are connected to low salinities.
The measured salinities in the ice cores were about 4 (station 291) and 6 (station 292). This
points to the river Lena (Tumatskaya branch) as the dominant source for low salinity, particle
loaden ice. This is further supported by the a l8 0 isotopic signature of the ice at these stations
(Eicken, person. commun.).
Near the river mouths new ice is preferably formed at the contact between river water near the
point of freezing and more saline water with a temperature below O°C (Golovin et aI., this
volume). The Laptev Sea was ice free at the end of September 1995 (Lindemann et aI., this
volume). New ice formation started in early October. Thus, the fast floating ice field north off
the delta was younger than 3 weeks. The meteorology during this period was characterized by
calm conditions without precipitation. These circumstances let us suggest that the ice floe
moved within a short period of time from its area of origination near the river mouth offshore
regions with a higher salinity of the underlying water column (29.1 at Station 291).
01()
35000
C>
•
a)
.><
b)
35
'5 30000
•
• ..)1.
1 25000
30
•• • II.
•
• • •
fit·
25
••• '" I
.f 20000
z..
".,.
•
S 20
••
a; 15000
•
'iO
• ~:s-.
..
15
>
(/)
••
Si 10000
10
. "
III
• •
,.,
(5 5000
••
j .•
•
0
0
20
40
60
eo 100 120 140
0
10
20
30
4 0
50
60
Dissolved Mo (nmol-kg" )
Dissolved Mo (nmol-kg ' )
-- 35
--'600
C>
•
C>
•
oX
d)
f 1400
c)
-!.. 30
0
0
E 1200
E 25
C
.s
~ 1000
•
B 20
~ 800
•
'0 15
•
'0
•
Ql
Ql 600
•
>
>
'0
'0
'0
400
-
III
III
III
III
Ci 5
Ci 200
•
.. - ~" .
. •
0
• . •
0
0
10
20
30
40
50
60
0
10
20
30
40
50
60
Dissolved Mo (nmol-kg" )
Dissolved Mo (nmol-kg ')
Figure 3, a-d: The good correlation between the salinity of a water sample and the dissolved molybdenum
concentration (3 a) allow to use the Mo content as a proxy for the salinity of an ice sample. Figures 3 b-d show
that high concentrations of dissolved Fe, Mn and Cd are usually observed in ice with Mo concentrations below
15 nmol kg-I, representing a salinity below 10. New and Young ice with low salinities was characteristic for the
region north off the Tumatskaya branch (Lena river).
Discussion
Trace elements in new ice, nilas and young ice.
With the exception of Zn and Cd the median concentration levels of particulate trace metals were
close to values typical for surface sediments and suspended matter from the Laptev Sea