

96
Land-Ocean Svstems in the Siberian Arctic: Dynamics and History
layer formation, because our aim was only to determine the boundary in parametric space
between to different regimes of mixing, but not to go deeply into the regime with no layer
formation. All the points for both experiments are presented on the Figure 3 in the (Ri,Re)
plane. For both experiments (that basically are related to different ranges of the Reynolds
number) it is possible to separate roughly the points with layering from the points without it by
the strait solid line on the Figure 3. This line results in the following power dependence:
Ricrit = 1.97·IQ-3·Reo. 88
(1)
Another important result of our analysis is the parameterization of the initial layer thickness
(see Figure 4). It follows from this figure, that
H = 2.0·(U/N)
(2)
This relation corresponds well with similar parameterization of Park et al. (1994). It should be
mentioned that the parameter UIN is physically analogous to the well-known Ozmidov
lengthscale (Ozmidov, 1965). This length scale characterize the largest vertical size of three
dimensional vortices in the stably stratified fluid, that is the largest vertical size of overturning.
However, we did not measured the turbulent energy dissipation and are unable to confirm that
the layer thickness is proportional to the Ozmidov length scale, although it seems to be so.
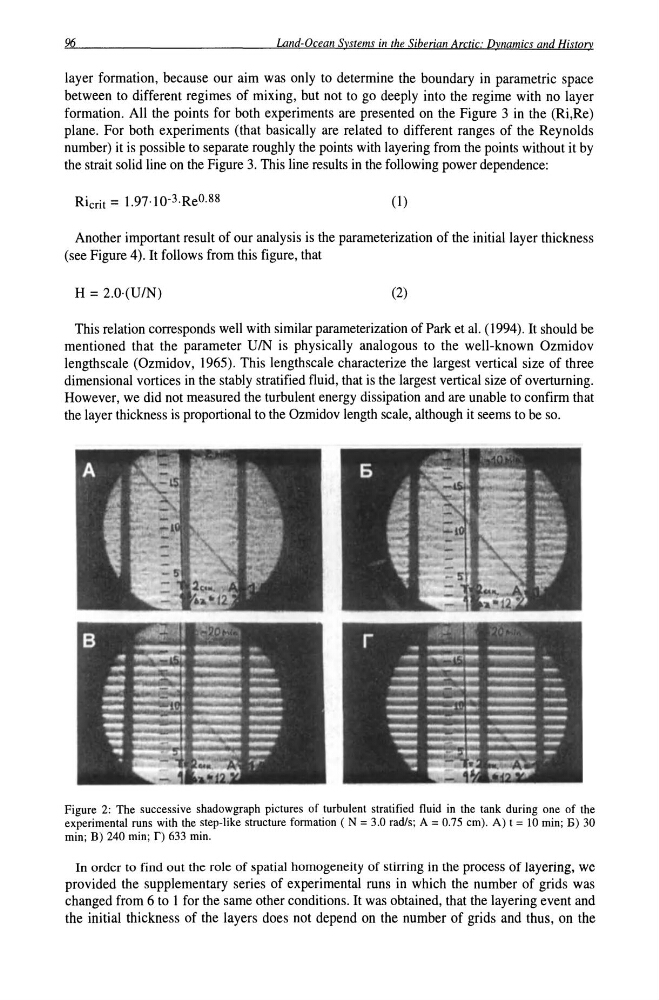
Figure 2: The successive shadow graph pictures of turbulent stratified fluid in the tank during one of the
experimental runs with the step-like structure formation ( N = 3.0 rad/s; A = 0.75 cm). A) t = 10 min; E) 30
min; B) 240 min; f) 633 min.
In order to find out the role of spatial homogeneity of stirring in the process of layering, we
provided the supplementary series of experimental runs in which the number of grids was
changed from 6 to 1 for the same other conditions. It was obtained, that the layering event and
the initial thickness of the layers does not depend on the number of grids and thus, on the
Land-Ocean Svstems in the Siberian Arctic: Dynamics and History
layer formation, because our aim was only to determine the boundary in parametric space
between to different regimes of mixing, but not to go deeply into the regime with no layer
formation. All the points for both experiments are presented on the Figure 3 in the (Ri,Re)
plane. For both experiments (that basically are related to different ranges of the Reynolds
number) it is possible to separate roughly the points with layering from the points without it by
the strait solid line on the Figure 3. This line results in the following power dependence:
Ricrit = 1.97·IQ-3·Reo. 88
(1)
Another important result of our analysis is the parameterization of the initial layer thickness
(see Figure 4). It follows from this figure, that
H = 2.0·(U/N)
(2)
This relation corresponds well with similar parameterization of Park et al. (1994). It should be
mentioned that the parameter UIN is physically analogous to the well-known Ozmidov
lengthscale (Ozmidov, 1965). This length scale characterize the largest vertical size of three
dimensional vortices in the stably stratified fluid, that is the largest vertical size of overturning.
However, we did not measured the turbulent energy dissipation and are unable to confirm that
the layer thickness is proportional to the Ozmidov length scale, although it seems to be so.
Figure 2: The successive shadow graph pictures of turbulent stratified fluid in the tank during one of the
experimental runs with the step-like structure formation ( N = 3.0 rad/s; A = 0.75 cm). A) t = 10 min; E) 30
min; B) 240 min; f) 633 min.
In order to find out the role of spatial homogeneity of stirring in the process of layering, we
provided the supplementary series of experimental runs in which the number of grids was
changed from 6 to 1 for the same other conditions. It was obtained, that the layering event and
the initial thickness of the layers does not depend on the number of grids and thus, on the