

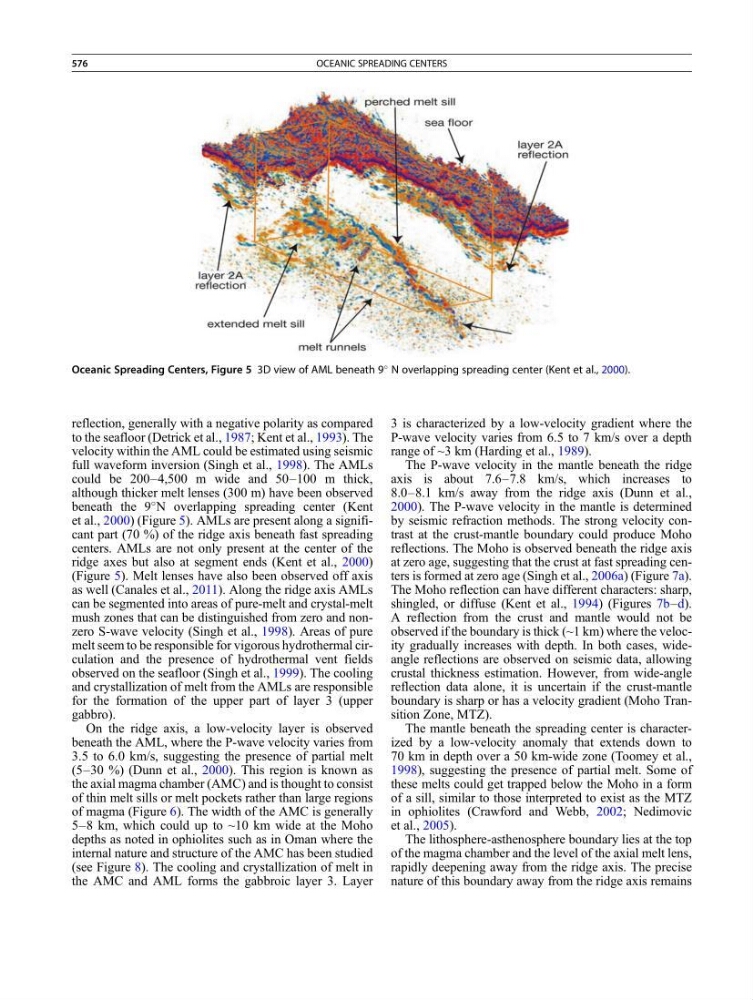
reflection, generally with a negative polarity as compared
to the seafloor (Detrick et al., 1987; Kent et al., 1993). The
velocity within the AML could be estimated using seismic
full waveform inversion (Singh et al., 1998). The AMLs
could be 200–4,500 m wide and 50–100 m thick,
although thicker melt lenses (300 m) have been observed
beneath the 9
N overlapping spreading center (Kent
et al., 2000) (Figure 5). AMLs are present along a significant part (70 %) of the ridge axis beneath fast spreading
centers. AMLs are not only present at the center of the
ridge axes but also at segment ends (Kent et al., 2000)
(Figure 5). Melt lenses have also been observed off axis
as well (Canales et al., 2011). Along the ridge axis AMLs
can be segmented into areas of pure-melt and crystal-melt
mush zones that can be distinguished from zero and nonzero S-wave velocity (Singh et al., 1998). Areas of pure
melt seem to be responsible for vigorous hydrothermal circulation and the presence of hydrothermal vent fields
observed on the seafloor (Singh et al., 1999). The cooling
and crystallization of melt from the AMLs are responsible
for the formation of the upper part of layer 3 (upper
gabbro).
On the ridge axis, a low-velocity layer is observed
beneath the AML, where the P-wave velocity varies from
3.5 to 6.0 km/s, suggesting the presence of partial melt
(5–30 %) (Dunn et al., 2000). This region is known as
the axial magma chamber (AMC) and is thought to consist
of thin melt sills or melt pockets rather than large regions
of magma (Figure 6). The width of the AMC is generally
5–8 km, which could up to ~10 km wide at the Moho
depths as noted in ophiolites such as in Oman where the
internal nature and structure of the AMC has been studied
(see Figure 8). The cooling and crystallization of melt in
the AMC and AML forms the gabbroic layer 3. Layer
3 is characterized by a low-velocity gradient where the
P-wave velocity varies from 6.5 to 7 km/s over a depth
range of ~3 km (Harding et al., 1989).
The P-wave velocity in the mantle beneath the ridge
axis is about 7.6–7.8 km/s, which increases to
8.0–8.1 km/s away from the ridge axis (Dunn et al.,
2000). The P-wave velocity in the mantle is determined
by seismic refraction methods. The strong velocity contrast at the crust-mantle boundary could produce Moho
reflections. The Moho is observed beneath the ridge axis
at zero age, suggesting that the crust at fast spreading centers is formed at zero age (Singh et al., 2006a) (Figure 7a).
The Moho reflection can have different characters: sharp,
shingled, or diffuse (Kent et al., 1994) (Figures 7b–d).
A reflection from the crust and mantle would not be
observed if the boundary is thick (~1 km) where the velocity gradually increases with depth. In both cases, wideangle reflections are observed on seismic data, allowing
crustal thickness estimation. However, from wide-angle
reflection data alone, it is uncertain if the crust-mantle
boundary is sharp or has a velocity gradient (Moho Transition Zone, MTZ).
The mantle beneath the spreading center is characterized by a low-velocity anomaly that extends down to
70 km in depth over a 50 km-wide zone (Toomey et al.,
1998), suggesting the presence of partial melt. Some of
these melts could get trapped below the Moho in a form
of a sill, similar to those interpreted to exist as the MTZ
in ophiolites (Crawford and Webb, 2002; Nedimovic
et al., 2005).
The lithosphere-asthenosphere boundary lies at the top
of the magma chamber and the level of the axial melt lens,
rapidly deepening away from the ridge axis. The precise
nature of this boundary away from the ridge axis remains
Oceanic Spreading Centers, Figure 5 3D view of AML beneath 9
N overlapping spreading center (Kent et al., 2000).
576
OCEANIC SPREADING CENTERS