

the pressure decreases leading to partial melting of the
mantle, yielding basaltic melt rising towards the surface
of the earth to form the oceanic crust. Part of the melt
erupts on the seafloor forming extrusive lava flows at the
ridge axis where it solidifies. Laboratory measurements
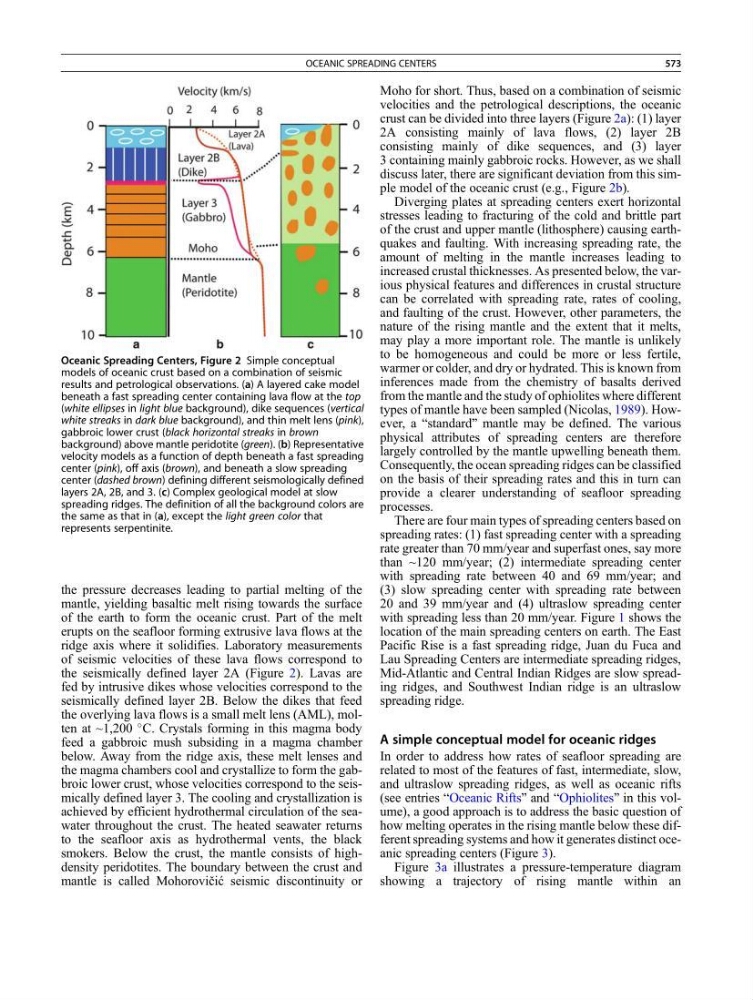
of seismic velocities of these lava flows correspond to
the seismically defined layer 2A (Figure 2). Lavas are
fed by intrusive dikes whose velocities correspond to the
seismically defined layer 2B. Below the dikes that feed
the overlying lava flows is a small melt lens (AML), molten at ~1,200
C. Crystals forming in this magma body
feed a gabbroic mush subsiding in a magma chamber
below. Away from the ridge axis, these melt lenses and
the magma chambers cool and crystallize to form the gabbroic lower crust, whose velocities correspond to the seismically defined layer 3. The cooling and crystallization is
achieved by efficient hydrothermal circulation of the seawater throughout the crust. The heated seawater returns
to the seafloor axis as hydrothermal vents, the black
smokers. Below the crust, the mantle consists of highdensity peridotites. The boundary between the crust and
mantle is called Mohorovičić seismic discontinuity or
Moho for short. Thus, based on a combination of seismic
velocities and the petrological descriptions, the oceanic
crust can be divided into three layers (Figure 2a): (1) layer
2A consisting mainly of lava flows, (2) layer 2B
consisting mainly of dike sequences, and (3) layer
3 containing mainly gabbroic rocks. However, as we shall
discuss later, there are significant deviation from this simple model of the oceanic crust (e.g., Figure 2b).
Diverging plates at spreading centers exert horizontal
stresses leading to fracturing of the cold and brittle part
of the crust and upper mantle (lithosphere) causing earthquakes and faulting. With increasing spreading rate, the
amount of melting in the mantle increases leading to
increased crustal thicknesses. As presented below, the various physical features and differences in crustal structure
can be correlated with spreading rate, rates of cooling,
and faulting of the crust. However, other parameters, the
nature of the rising mantle and the extent that it melts,
may play a more important role. The mantle is unlikely
to be homogeneous and could be more or less fertile,
warmer or colder, and dry or hydrated. This is known from
inferences made from the chemistry of basalts derived
from the mantle and the study of ophiolites where different
types of mantle have been sampled (Nicolas, 1989). However, a “standard” mantle may be defined. The various
physical attributes of spreading centers are therefore
largely controlled by the mantle upwelling beneath them.
Consequently, the ocean spreading ridges can be classified
on the basis of their spreading rates and this in turn can
provide a clearer understanding of seafloor spreading
processes.
There are four main types of spreading centers based on
spreading rates: (1) fast spreading center with a spreading
rate greater than 70 mm/year and superfast ones, say more
than ~120 mm/year; (2) intermediate spreading center
with spreading rate between 40 and 69 mm/year; and
(3) slow spreading center with spreading rate between
20 and 39 mm/year and (4) ultraslow spreading center
with spreading less than 20 mm/year. Figure 1 shows the
location of the main spreading centers on earth. The East
Pacific Rise is a fast spreading ridge, Juan du Fuca and
Lau Spreading Centers are intermediate spreading ridges,
Mid-Atlantic and Central Indian Ridges are slow spreading ridges, and Southwest Indian ridge is an ultraslow
spreading ridge.
A simple conceptual model for oceanic ridges
In order to address how rates of seafloor spreading are
related to most of the features of fast, intermediate, slow,
and ultraslow spreading ridges, as well as oceanic rifts
(see entries “Oceanic Rifts” and “Ophiolites” in this volume), a good approach is to address the basic question of
how melting operates in the rising mantle below these different spreading systems and how it generates distinct oceanic spreading centers (Figure 3).
Figure 3a illustrates a pressure-temperature diagram
showing a trajectory of rising mantle within an
Oceanic Spreading Centers, Figure 2 Simple conceptual
models of oceanic crust based on a combination of seismic
results and petrological observations. (a) A layered cake model
beneath a fast spreading center containing lava flow at the top
(white ellipses in light blue background), dike sequences (vertical
white streaks in dark blue background), and thin melt lens (pink),
gabbroic lower crust (black horizontal streaks in brown
background) above mantle peridotite (green). (b) Representative
velocity models as a function of depth beneath a fast spreading
center (pink), off axis (brown), and beneath a slow spreading
center (dashed brown) defining different seismologically defined
layers 2A, 2B, and 3. (c) Complex geological model at slow
spreading ridges. The definition of all the background colors are
the same as that in (a), except the light green color that
represents serpentinite.
OCEANIC SPREADING CENTERS
573