

model of the lithosphere, while shallower depths, a “flattening,” favor a model of the lithosphere with basal heat
input (plate, constant basal temperature, or, CHABLIS,
constant basal heat flow (Doin and Fleitout, 1996)). Hillier
(2010) has shown conclusively that the depths flatten with
age on oldest ocean floor strongly favoring a model with
basal heat input. This impacts upon expectations for seafloor heat flow.
Under continued scrutiny, how the depth and heat flow
data are selected and the above controversy have brought
to light two problems with the models. First, the plate
thickness using the selected provinces was always thicker
than that for the data taken as a whole. Second, Nagihara
et al. (1996) summarized a series of carefully selected heat
flow surveys on old ocean floor. They pointed out that neither the boundary layer nor GDH1 and the Parson and
Sclater (1977) plate models could explain both the heat
flow and age and depth and age relations on the oldest
(>130 Ma) ocean floor without assuming the addition of
an unreasonably high value for the crustal radioactivity.
The data selection remains critical and a key to refining
models.
Heat flow data
The global heat flow compilation published by the International Heat Flow Commission reported more than
22,000 stations. It incorporated the earlier work of Lee
and Uyeda (1965), Simmons and Horai (1968), Jessop
et al. (1975), Pollock et al. (1993), and Gosnold and Panda
(2002)
(http:www.geophysik.rwth.aachen.de/IHFC/
heatflow.html). This database has been updated and
extended by Laske and Masters (http://igppweb.ucsd.
edu/~gabi/ rem.html). It was used in Davies and Davies
(2010) and Davies (2013).
The latest papers reference compilations that now
include >50,000 unique heat flow sites worldwide.
The majority of the data are sparsely but relatively
evenly distributed across the globe with a few isolated
high-definition studies. For this review, we considered
two recent compilations: Hasterok (2010) slightly
updated in 2013 and Goutorbe et al. (2011). For the
marine realm, both consist of about 14,000 + heat
values, if the measurements on the shallow continental
shelf are ignored. They differ mostly in the amount of
confidential industry data that have been included. All
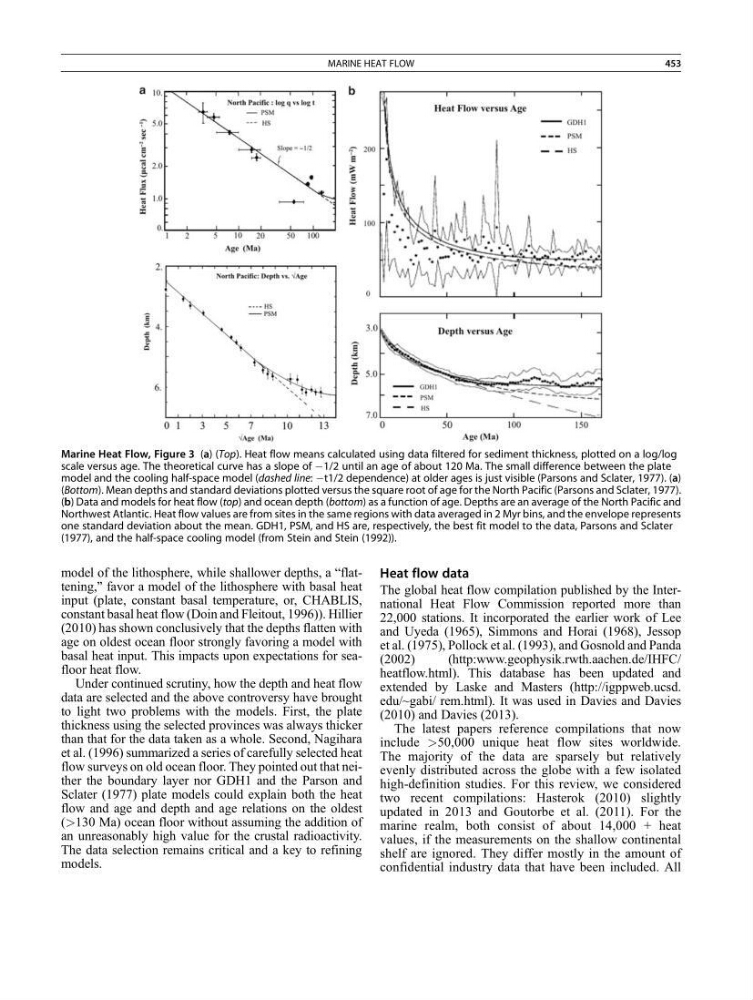
Marine Heat Flow, Figure 3 (a) (Top). Heat flow means calculated using data filtered for sediment thickness, plotted on a log/log
scale versus age. The theoretical curve has a slope of À1/2 until an age of about 120 Ma. The small difference between the plate
model and the cooling half-space model (dashed line: Àt1/2 dependence) at older ages is just visible (Parsons and Sclater, 1977). (a)
(Bottom). Mean depths and standard deviations plotted versus the square root of age for the North Pacific (Parsons and Sclater, 1977).
(b) Data and models for heat flow (top) and ocean depth (bottom) as a function of age. Depths are an average of the North Pacific and
Northwest Atlantic. Heat flow values are from sites in the same regions with data averaged in 2 Myr bins, and the envelope represents
one standard deviation about the mean. GDH1, PSM, and HS are, respectively, the best fit model to the data, Parsons and Sclater
(1977), and the half-space cooling model (from Stein and Stein (1992)).
MARINE HEAT FLOW
453
input (plate, constant basal temperature, or, CHABLIS,
constant basal heat flow (Doin and Fleitout, 1996)). Hillier
(2010) has shown conclusively that the depths flatten with
age on oldest ocean floor strongly favoring a model with
basal heat input. This impacts upon expectations for seafloor heat flow.
Under continued scrutiny, how the depth and heat flow
data are selected and the above controversy have brought
to light two problems with the models. First, the plate
thickness using the selected provinces was always thicker
than that for the data taken as a whole. Second, Nagihara
et al. (1996) summarized a series of carefully selected heat
flow surveys on old ocean floor. They pointed out that neither the boundary layer nor GDH1 and the Parson and
Sclater (1977) plate models could explain both the heat
flow and age and depth and age relations on the oldest
(>130 Ma) ocean floor without assuming the addition of
an unreasonably high value for the crustal radioactivity.
The data selection remains critical and a key to refining
models.
Heat flow data
The global heat flow compilation published by the International Heat Flow Commission reported more than
22,000 stations. It incorporated the earlier work of Lee
and Uyeda (1965), Simmons and Horai (1968), Jessop
et al. (1975), Pollock et al. (1993), and Gosnold and Panda
(2002)
(http:www.geophysik.rwth.aachen.de/IHFC/
heatflow.html). This database has been updated and
extended by Laske and Masters (http://igppweb.ucsd.
edu/~gabi/ rem.html). It was used in Davies and Davies
(2010) and Davies (2013).
The latest papers reference compilations that now
include >50,000 unique heat flow sites worldwide.
The majority of the data are sparsely but relatively
evenly distributed across the globe with a few isolated
high-definition studies. For this review, we considered
two recent compilations: Hasterok (2010) slightly
updated in 2013 and Goutorbe et al. (2011). For the
marine realm, both consist of about 14,000 + heat
values, if the measurements on the shallow continental
shelf are ignored. They differ mostly in the amount of
confidential industry data that have been included. All
Marine Heat Flow, Figure 3 (a) (Top). Heat flow means calculated using data filtered for sediment thickness, plotted on a log/log
scale versus age. The theoretical curve has a slope of À1/2 until an age of about 120 Ma. The small difference between the plate
model and the cooling half-space model (dashed line: Àt1/2 dependence) at older ages is just visible (Parsons and Sclater, 1977). (a)
(Bottom). Mean depths and standard deviations plotted versus the square root of age for the North Pacific (Parsons and Sclater, 1977).
(b) Data and models for heat flow (top) and ocean depth (bottom) as a function of age. Depths are an average of the North Pacific and
Northwest Atlantic. Heat flow values are from sites in the same regions with data averaged in 2 Myr bins, and the envelope represents
one standard deviation about the mean. GDH1, PSM, and HS are, respectively, the best fit model to the data, Parsons and Sclater
(1977), and the half-space cooling model (from Stein and Stein (1992)).
MARINE HEAT FLOW
453