

of DNA and IPL in deeply buried sediments (e.g., stabilized on clay surfaces or organic matter; Coolen et al.,
2006; Inagaki and Nealson, 2006; Schippers and Neretin,
2006). The preservation of archaeal IPL biomarkers in
marine sediments has been confirmed based on experimental and modeling approaches (Schouten et al., 2010;
Logemann et al., 2011; Xie et al., 2013). These indicate
that due to their different chemical nature, a faster degradation of ester-bound bacterial than of ether-bound
archaeal IPLs leads to an increasing proportion of archaeal
IPL with sediment depth. The fossilized archaeal IPLs
mainly derived from sedimented Archaea from the water
column were masking the much smaller pool of IPLs from
living cells in the sediments. As a consequence, the
published IPL data do not reflect the abundance of living
Archaea, and the conclusion that Archaea are dominant
in deeply buried sediments is therefore questionable
(Lipp et al., 2008; Xie et al., 2013).
Life in the ocean crust
Some recent review papers give an overview about life in
the ocean crust (Edwards et al., 2005, 2012; Schrenk et al.,
2010; Orcutt et al., 2011). Nearly 70 % of the Earth’s surface is covered by ocean crust of which the major part is
covered by sediments. The marine deep biosphere in the
10
5
10
6
10
7
10
8
10
9
10
10
0
1
2
3
4
5
SGDC 1
SGDC 2
Bacteria
Archaea
Depths (mbsf)
10
5
10
6
10
7
10
8
10
9 10
10
0
1
2
3
4
5
Bacteria
Archaea
Eukarya
Crenarchaeota
JS1-Chloroflexi
Prokaryotes
Geobacteraceae
10
5 10
6 10
7 10
8 10
9 10
10
0
1
2
3
4
5
mcrA 1
dsrA
aprA
cbbL
mcrA 2
10
5
10
6
10
7
10
8
10
9
10
10
0
2
4
6
8
10
Cells per mL sediment
Depths (mbsf)
10
4
10
5
10
6
10
7
10
8
10
9
10
10
0
2
4
6
8
10
16S rRNA gene copies per mL sediment
1000 10
4
100 1000 10
4
100 1000 10
4
10
5
10
6
10
7
10
8
0
2
4
6
8
10
functional gene copies per mL sediment
Total counts and CARD-FISH
Q-PCR
Q-PCR
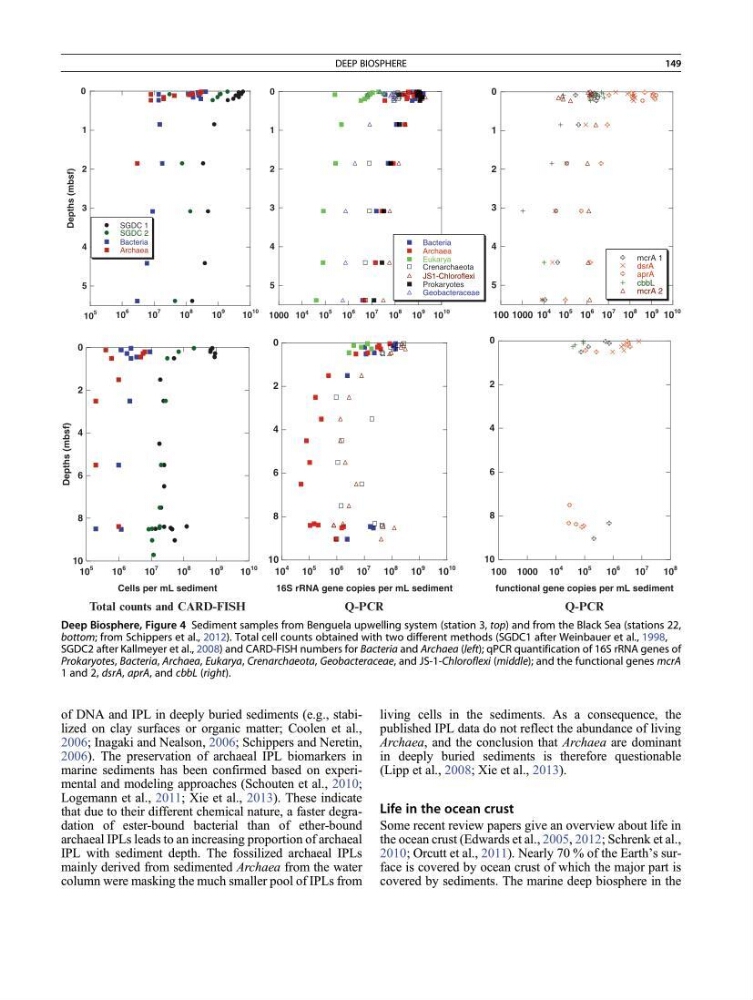
Deep Biosphere, Figure 4 Sediment samples from Benguela upwelling system (station 3, top) and from the Black Sea (stations 22,
bottom; from Schippers et al., 2012). Total cell counts obtained with two different methods (SGDC1 after Weinbauer et al., 1998,
SGDC2 after Kallmeyer et al., 2008) and CARD-FISH numbers for Bacteria and Archaea (left); qPCR quantification of 16S rRNA genes of
Prokaryotes, Bacteria, Archaea, Eukarya, Crenarchaeota, Geobacteraceae, and JS-1-Chloroflexi (middle); and the functional genes mcrA
1 and 2, dsrA, aprA, and cbbL (right).
DEEP BIOSPHERE
149
2006; Inagaki and Nealson, 2006; Schippers and Neretin,
2006). The preservation of archaeal IPL biomarkers in
marine sediments has been confirmed based on experimental and modeling approaches (Schouten et al., 2010;
Logemann et al., 2011; Xie et al., 2013). These indicate
that due to their different chemical nature, a faster degradation of ester-bound bacterial than of ether-bound
archaeal IPLs leads to an increasing proportion of archaeal
IPL with sediment depth. The fossilized archaeal IPLs
mainly derived from sedimented Archaea from the water
column were masking the much smaller pool of IPLs from
living cells in the sediments. As a consequence, the
published IPL data do not reflect the abundance of living
Archaea, and the conclusion that Archaea are dominant
in deeply buried sediments is therefore questionable
(Lipp et al., 2008; Xie et al., 2013).
Life in the ocean crust
Some recent review papers give an overview about life in
the ocean crust (Edwards et al., 2005, 2012; Schrenk et al.,
2010; Orcutt et al., 2011). Nearly 70 % of the Earth’s surface is covered by ocean crust of which the major part is
covered by sediments. The marine deep biosphere in the
10
5
10
6
10
7
10
8
10
9
10
10
0
1
2
3
4
5
SGDC 1
SGDC 2
Bacteria
Archaea
Depths (mbsf)
10
5
10
6
10
7
10
8
10
9 10
10
0
1
2
3
4
5
Bacteria
Archaea
Eukarya
Crenarchaeota
JS1-Chloroflexi
Prokaryotes
Geobacteraceae
10
5 10
6 10
7 10
8 10
9 10
10
0
1
2
3
4
5
mcrA 1
dsrA
aprA
cbbL
mcrA 2
10
5
10
6
10
7
10
8
10
9
10
10
0
2
4
6
8
10
Cells per mL sediment
Depths (mbsf)
10
4
10
5
10
6
10
7
10
8
10
9
10
10
0
2
4
6
8
10
16S rRNA gene copies per mL sediment
1000 10
4
100 1000 10
4
100 1000 10
4
10
5
10
6
10
7
10
8
0
2
4
6
8
10
functional gene copies per mL sediment
Total counts and CARD-FISH
Q-PCR
Q-PCR
Deep Biosphere, Figure 4 Sediment samples from Benguela upwelling system (station 3, top) and from the Black Sea (stations 22,
bottom; from Schippers et al., 2012). Total cell counts obtained with two different methods (SGDC1 after Weinbauer et al., 1998,
SGDC2 after Kallmeyer et al., 2008) and CARD-FISH numbers for Bacteria and Archaea (left); qPCR quantification of 16S rRNA genes of
Prokaryotes, Bacteria, Archaea, Eukarya, Crenarchaeota, Geobacteraceae, and JS-1-Chloroflexi (middle); and the functional genes mcrA
1 and 2, dsrA, aprA, and cbbL (right).
DEEP BIOSPHERE
149