

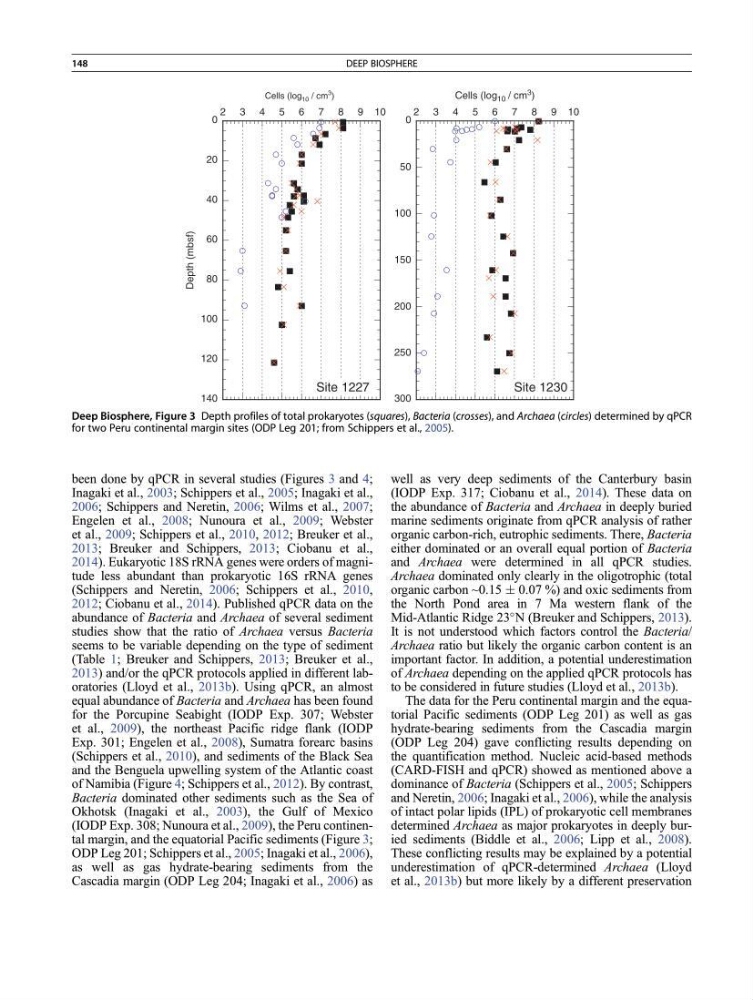
been done by qPCR in several studies (Figures 3 and 4;
Inagaki et al., 2003; Schippers et al., 2005; Inagaki et al.,
2006; Schippers and Neretin, 2006; Wilms et al., 2007;
Engelen et al., 2008; Nunoura et al., 2009; Webster
et al., 2009; Schippers et al., 2010, 2012; Breuker et al.,
2013; Breuker and Schippers, 2013; Ciobanu et al.,
2014). Eukaryotic 18S rRNA genes were orders of magnitude less abundant than prokaryotic 16S rRNA genes
(Schippers and Neretin, 2006; Schippers et al., 2010,
2012; Ciobanu et al., 2014). Published qPCR data on the
abundance of Bacteria and Archaea of several sediment
studies show that the ratio of Archaea versus Bacteria
seems to be variable depending on the type of sediment
(Table 1; Breuker and Schippers, 2013; Breuker et al.,
2013) and/or the qPCR protocols applied in different laboratories (Lloyd et al., 2013b). Using qPCR, an almost
equal abundance of Bacteria and Archaea has been found
for the Porcupine Seabight (IODP Exp. 307; Webster
et al., 2009), the northeast Pacific ridge flank (IODP
Exp. 301; Engelen et al., 2008), Sumatra forearc basins
(Schippers et al., 2010), and sediments of the Black Sea
and the Benguela upwelling system of the Atlantic coast
of Namibia (Figure 4; Schippers et al., 2012). By contrast,
Bacteria dominated other sediments such as the Sea of
Okhotsk (Inagaki et al., 2003), the Gulf of Mexico
(IODP Exp. 308; Nunoura et al., 2009), the Peru continental margin, and the equatorial Pacific sediments (Figure 3;
ODP Leg 201; Schippers et al., 2005; Inagaki et al., 2006),
as well as gas hydrate-bearing sediments from the
Cascadia margin (ODP Leg 204; Inagaki et al., 2006) as
well as very deep sediments of the Canterbury basin
(IODP Exp. 317; Ciobanu et al., 2014). These data on
the abundance of Bacteria and Archaea in deeply buried
marine sediments originate from qPCR analysis of rather
organic carbon-rich, eutrophic sediments. There, Bacteria
either dominated or an overall equal portion of Bacteria
and Archaea were determined in all qPCR studies.
Archaea dominated only clearly in the oligotrophic (total
organic carbon ~0.15 Æ 0.07 %) and oxic sediments from
the North Pond area in 7 Ma western flank of the
Mid-Atlantic Ridge 23
N (Breuker and Schippers, 2013).
It is not understood which factors control the Bacteria/
Archaea ratio but likely the organic carbon content is an
important factor. In addition, a potential underestimation
of Archaea depending on the applied qPCR protocols has
to be considered in future studies (Lloyd et al., 2013b).
The data for the Peru continental margin and the equatorial Pacific sediments (ODP Leg 201) as well as gas
hydrate-bearing sediments from the Cascadia margin
(ODP Leg 204) gave conflicting results depending on
the quantification method. Nucleic acid-based methods
(CARD-FISH and qPCR) showed as mentioned above a
dominance of Bacteria (Schippers et al., 2005; Schippers
and Neretin, 2006; Inagaki et al., 2006), while the analysis
of intact polar lipids (IPL) of prokaryotic cell membranes
determined Archaea as major prokaryotes in deeply buried sediments (Biddle et al., 2006; Lipp et al., 2008).
These conflicting results may be explained by a potential
underestimation of qPCR-determined Archaea (Lloyd
et al., 2013b) but more likely by a different preservation
0
20
40
60
80
100
120
140
Site 1227
Depth (mbsf)
Cells (log 10 / cm
3 )
Cells (log 10 / cm
3 )
2 3 4 5 6 7 8 9 10
2 3 4 5 6 7 8 9 10
0
50
100
150
200
250
300
Site 1230
Deep Biosphere, Figure 3 Depth profiles of total prokaryotes (squares), Bacteria (crosses), and Archaea (circles) determined by qPCR
for two Peru continental margin sites (ODP Leg 201; from Schippers et al., 2005).
148
DEEP BIOSPHERE
Inagaki et al., 2003; Schippers et al., 2005; Inagaki et al.,
2006; Schippers and Neretin, 2006; Wilms et al., 2007;
Engelen et al., 2008; Nunoura et al., 2009; Webster
et al., 2009; Schippers et al., 2010, 2012; Breuker et al.,
2013; Breuker and Schippers, 2013; Ciobanu et al.,
2014). Eukaryotic 18S rRNA genes were orders of magnitude less abundant than prokaryotic 16S rRNA genes
(Schippers and Neretin, 2006; Schippers et al., 2010,
2012; Ciobanu et al., 2014). Published qPCR data on the
abundance of Bacteria and Archaea of several sediment
studies show that the ratio of Archaea versus Bacteria
seems to be variable depending on the type of sediment
(Table 1; Breuker and Schippers, 2013; Breuker et al.,
2013) and/or the qPCR protocols applied in different laboratories (Lloyd et al., 2013b). Using qPCR, an almost
equal abundance of Bacteria and Archaea has been found
for the Porcupine Seabight (IODP Exp. 307; Webster
et al., 2009), the northeast Pacific ridge flank (IODP
Exp. 301; Engelen et al., 2008), Sumatra forearc basins
(Schippers et al., 2010), and sediments of the Black Sea
and the Benguela upwelling system of the Atlantic coast
of Namibia (Figure 4; Schippers et al., 2012). By contrast,
Bacteria dominated other sediments such as the Sea of
Okhotsk (Inagaki et al., 2003), the Gulf of Mexico
(IODP Exp. 308; Nunoura et al., 2009), the Peru continental margin, and the equatorial Pacific sediments (Figure 3;
ODP Leg 201; Schippers et al., 2005; Inagaki et al., 2006),
as well as gas hydrate-bearing sediments from the
Cascadia margin (ODP Leg 204; Inagaki et al., 2006) as
well as very deep sediments of the Canterbury basin
(IODP Exp. 317; Ciobanu et al., 2014). These data on
the abundance of Bacteria and Archaea in deeply buried
marine sediments originate from qPCR analysis of rather
organic carbon-rich, eutrophic sediments. There, Bacteria
either dominated or an overall equal portion of Bacteria
and Archaea were determined in all qPCR studies.
Archaea dominated only clearly in the oligotrophic (total
organic carbon ~0.15 Æ 0.07 %) and oxic sediments from
the North Pond area in 7 Ma western flank of the
Mid-Atlantic Ridge 23
N (Breuker and Schippers, 2013).
It is not understood which factors control the Bacteria/
Archaea ratio but likely the organic carbon content is an
important factor. In addition, a potential underestimation
of Archaea depending on the applied qPCR protocols has
to be considered in future studies (Lloyd et al., 2013b).
The data for the Peru continental margin and the equatorial Pacific sediments (ODP Leg 201) as well as gas
hydrate-bearing sediments from the Cascadia margin
(ODP Leg 204) gave conflicting results depending on
the quantification method. Nucleic acid-based methods
(CARD-FISH and qPCR) showed as mentioned above a
dominance of Bacteria (Schippers et al., 2005; Schippers
and Neretin, 2006; Inagaki et al., 2006), while the analysis
of intact polar lipids (IPL) of prokaryotic cell membranes
determined Archaea as major prokaryotes in deeply buried sediments (Biddle et al., 2006; Lipp et al., 2008).
These conflicting results may be explained by a potential
underestimation of qPCR-determined Archaea (Lloyd
et al., 2013b) but more likely by a different preservation
0
20
40
60
80
100
120
140
Site 1227
Depth (mbsf)
Cells (log 10 / cm
3 )
Cells (log 10 / cm
3 )
2 3 4 5 6 7 8 9 10
2 3 4 5 6 7 8 9 10
0
50
100
150
200
250
300
Site 1230
Deep Biosphere, Figure 3 Depth profiles of total prokaryotes (squares), Bacteria (crosses), and Archaea (circles) determined by qPCR
for two Peru continental margin sites (ODP Leg 201; from Schippers et al., 2005).
148
DEEP BIOSPHERE