

2 Topography, Hydrography, Circulation and Modelling of the Baltic Sea
57
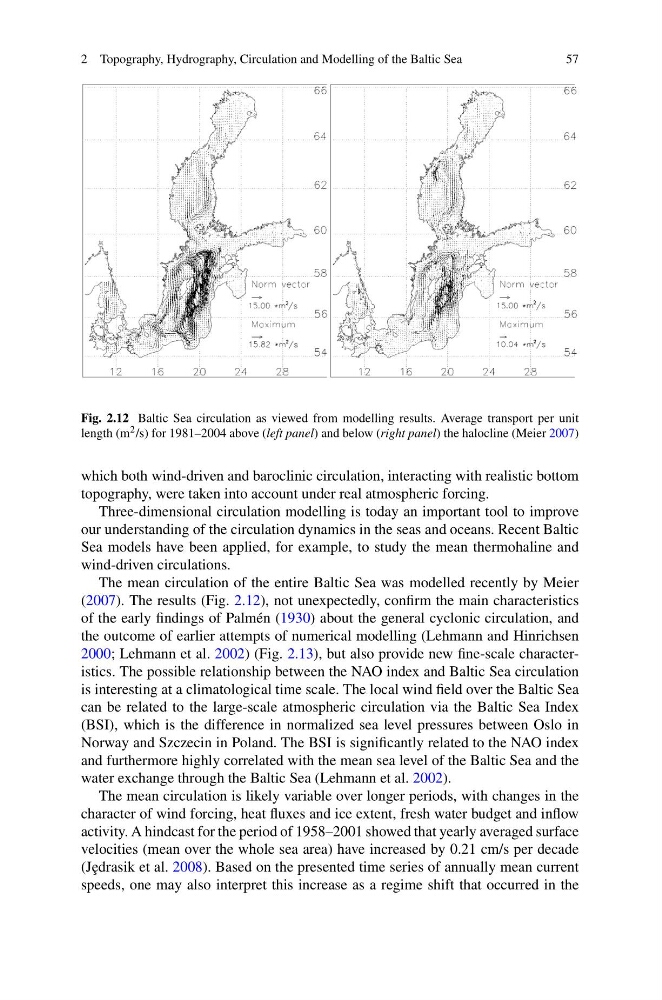
Fig. 2.12 Baltic Sea circulation as viewed from modelling results. Average transport per unit
length (m 2 /s) for 1981–2004 above (left panel) and below (right panel) the halocline (Meier 2007)
which both wind-driven and baroclinic circulation, interacting with realistic bottom
topography, were taken into account under real atmospheric forcing.
Three-dimensional circulation modelling is today an important tool to improve
our understanding of the circulation dynamics in the seas and oceans. Recent Baltic
Sea models have been applied, for example, to study the mean thermohaline and
wind-driven circulations.
The mean circulation of the entire Baltic Sea was modelled recently by Meier
(2007). The results (Fig. 2.12), not unexpectedly, confirm the main characteristics
of the early findings of Palmén (1930) about the general cyclonic circulation, and
the outcome of earlier attempts of numerical modelling (Lehmann and Hinrichsen
2000; Lehmann et al. 2002) (Fig. 2.13), but also provide new fine-scale characteristics. The possible relationship between the NAO index and Baltic Sea circulation
is interesting at a climatological time scale. The local wind field over the Baltic Sea
can be related to the large-scale atmospheric circulation via the Baltic Sea Index
(BSI), which is the difference in normalized sea level pressures between Oslo in
Norway and Szczecin in Poland. The BSI is significantly related to the NAO index
and furthermore highly correlated with the mean sea level of the Baltic Sea and the
water exchange through the Baltic Sea (Lehmann et al. 2002).
The mean circulation is likely variable over longer periods, with changes in the
character of wind forcing, heat fluxes and ice extent, fresh water budget and inflow
activity. A hindcast for the period of 1958–2001 showed that yearly averaged surface
velocities (mean over the whole sea area) have increased by 0.21 cm/s per decade
(Je ¸drasik et al. 2008). Based on the presented time series of annually mean current
speeds, one may also interpret this increase as a regime shift that occurred in the
57
Fig. 2.12 Baltic Sea circulation as viewed from modelling results. Average transport per unit
length (m 2 /s) for 1981–2004 above (left panel) and below (right panel) the halocline (Meier 2007)
which both wind-driven and baroclinic circulation, interacting with realistic bottom
topography, were taken into account under real atmospheric forcing.
Three-dimensional circulation modelling is today an important tool to improve
our understanding of the circulation dynamics in the seas and oceans. Recent Baltic
Sea models have been applied, for example, to study the mean thermohaline and
wind-driven circulations.
The mean circulation of the entire Baltic Sea was modelled recently by Meier
(2007). The results (Fig. 2.12), not unexpectedly, confirm the main characteristics
of the early findings of Palmén (1930) about the general cyclonic circulation, and
the outcome of earlier attempts of numerical modelling (Lehmann and Hinrichsen
2000; Lehmann et al. 2002) (Fig. 2.13), but also provide new fine-scale characteristics. The possible relationship between the NAO index and Baltic Sea circulation
is interesting at a climatological time scale. The local wind field over the Baltic Sea
can be related to the large-scale atmospheric circulation via the Baltic Sea Index
(BSI), which is the difference in normalized sea level pressures between Oslo in
Norway and Szczecin in Poland. The BSI is significantly related to the NAO index
and furthermore highly correlated with the mean sea level of the Baltic Sea and the
water exchange through the Baltic Sea (Lehmann et al. 2002).
The mean circulation is likely variable over longer periods, with changes in the
character of wind forcing, heat fluxes and ice extent, fresh water budget and inflow
activity. A hindcast for the period of 1958–2001 showed that yearly averaged surface
velocities (mean over the whole sea area) have increased by 0.21 cm/s per decade
(Je ¸drasik et al. 2008). Based on the presented time series of annually mean current
speeds, one may also interpret this increase as a regime shift that occurred in the