

56
K. Myrberg and A. Lehmann
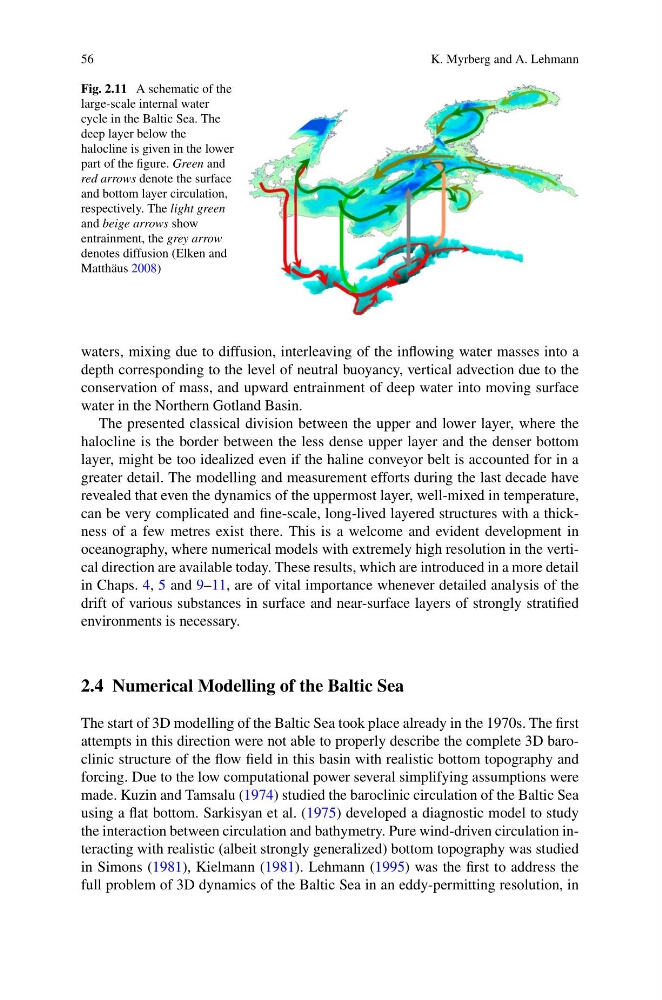
Fig. 2.11 A schematic of the
large-scale internal water
cycle in the Baltic Sea. The
deep layer below the
halocline is given in the lower
part of the figure. Green and
red arrows denote the surface
and bottom layer circulation,
respectively. The light green
and beige arrows show
entrainment, the grey arrow
denotes diffusion (Elken and
Matthäus 2008)
waters, mixing due to diffusion, interleaving of the inflowing water masses into a
depth corresponding to the level of neutral buoyancy, vertical advection due to the
conservation of mass, and upward entrainment of deep water into moving surface
water in the Northern Gotland Basin.
The presented classical division between the upper and lower layer, where the
halocline is the border between the less dense upper layer and the denser bottom
layer, might be too idealized even if the haline conveyor belt is accounted for in a
greater detail. The modelling and measurement efforts during the last decade have
revealed that even the dynamics of the uppermost layer, well-mixed in temperature,
can be very complicated and fine-scale, long-lived layered structures with a thickness of a few metres exist there. This is a welcome and evident development in
oceanography, where numerical models with extremely high resolution in the vertical direction are available today. These results, which are introduced in a more detail
in Chaps. 4, 5 and 9–11, are of vital importance whenever detailed analysis of the
drift of various substances in surface and near-surface layers of strongly stratified
environments is necessary.
2.4 Numerical Modelling of the Baltic Sea
The start of 3D modelling of the Baltic Sea took place already in the 1970s. The first
attempts in this direction were not able to properly describe the complete 3D baroclinic structure of the flow field in this basin with realistic bottom topography and
forcing. Due to the low computational power several simplifying assumptions were
made. Kuzin and Tamsalu (1974) studied the baroclinic circulation of the Baltic Sea
using a flat bottom. Sarkisyan et al. (1975) developed a diagnostic model to study
the interaction between circulation and bathymetry. Pure wind-driven circulation interacting with realistic (albeit strongly generalized) bottom topography was studied
in Simons (1981), Kielmann (1981). Lehmann (1995) was the first to address the
full problem of 3D dynamics of the Baltic Sea in an eddy-permitting resolution, in
K. Myrberg and A. Lehmann
Fig. 2.11 A schematic of the
large-scale internal water
cycle in the Baltic Sea. The
deep layer below the
halocline is given in the lower
part of the figure. Green and
red arrows denote the surface
and bottom layer circulation,
respectively. The light green
and beige arrows show
entrainment, the grey arrow
denotes diffusion (Elken and
Matthäus 2008)
waters, mixing due to diffusion, interleaving of the inflowing water masses into a
depth corresponding to the level of neutral buoyancy, vertical advection due to the
conservation of mass, and upward entrainment of deep water into moving surface
water in the Northern Gotland Basin.
The presented classical division between the upper and lower layer, where the
halocline is the border between the less dense upper layer and the denser bottom
layer, might be too idealized even if the haline conveyor belt is accounted for in a
greater detail. The modelling and measurement efforts during the last decade have
revealed that even the dynamics of the uppermost layer, well-mixed in temperature,
can be very complicated and fine-scale, long-lived layered structures with a thickness of a few metres exist there. This is a welcome and evident development in
oceanography, where numerical models with extremely high resolution in the vertical direction are available today. These results, which are introduced in a more detail
in Chaps. 4, 5 and 9–11, are of vital importance whenever detailed analysis of the
drift of various substances in surface and near-surface layers of strongly stratified
environments is necessary.
2.4 Numerical Modelling of the Baltic Sea
The start of 3D modelling of the Baltic Sea took place already in the 1970s. The first
attempts in this direction were not able to properly describe the complete 3D baroclinic structure of the flow field in this basin with realistic bottom topography and
forcing. Due to the low computational power several simplifying assumptions were
made. Kuzin and Tamsalu (1974) studied the baroclinic circulation of the Baltic Sea
using a flat bottom. Sarkisyan et al. (1975) developed a diagnostic model to study
the interaction between circulation and bathymetry. Pure wind-driven circulation interacting with realistic (albeit strongly generalized) bottom topography was studied
in Simons (1981), Kielmann (1981). Lehmann (1995) was the first to address the
full problem of 3D dynamics of the Baltic Sea in an eddy-permitting resolution, in