

58
K. Myrberg and A. Lehmann
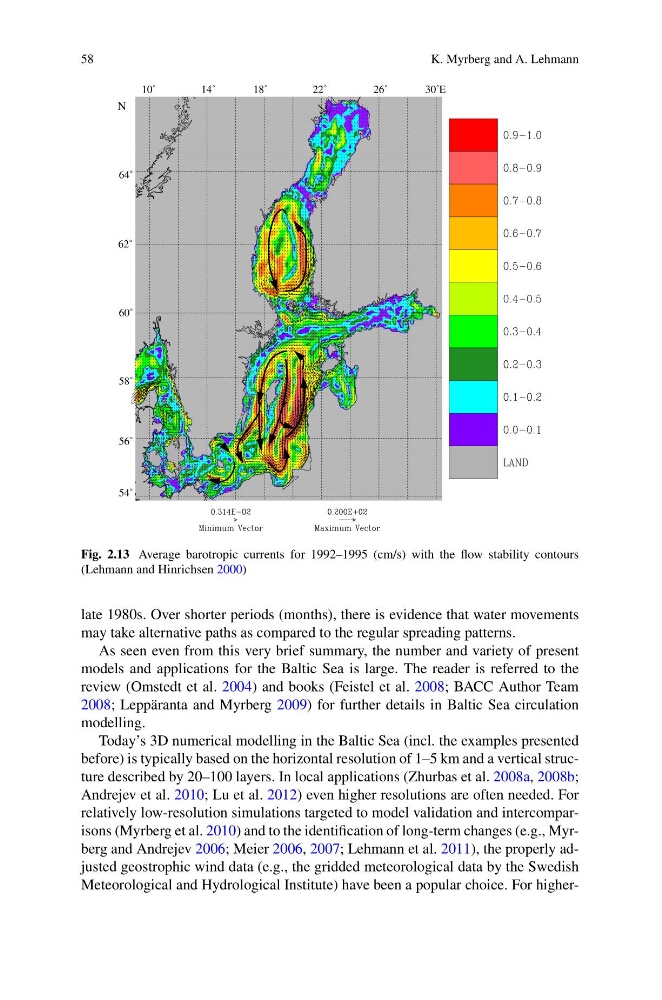
Fig. 2.13 Average barotropic currents for 1992–1995 (cm/s) with the flow stability contours
(Lehmann and Hinrichsen 2000)
late 1980s. Over shorter periods (months), there is evidence that water movements
may take alternative paths as compared to the regular spreading patterns.
As seen even from this very brief summary, the number and variety of present
models and applications for the Baltic Sea is large. The reader is referred to the
review (Omstedt et al. 2004) and books (Feistel et al. 2008; BACC Author Team
2008; Leppäranta and Myrberg 2009) for further details in Baltic Sea circulation
modelling.
Today’s 3D numerical modelling in the Baltic Sea (incl. the examples presented
before) is typically based on the horizontal resolution of 1–5 km and a vertical structure described by 20–100 layers. In local applications (Zhurbas et al. 2008a, 2008b;
Andrejev et al. 2010; Lu et al. 2012) even higher resolutions are often needed. For
relatively low-resolution simulations targeted to model validation and intercomparisons (Myrberg et al. 2010) and to the identification of long-term changes (e.g., Myrberg and Andrejev 2006; Meier 2006, 2007; Lehmann et al. 2011), the properly adjusted geostrophic wind data (e.g., the gridded meteorological data by the Swedish
Meteorological and Hydrological Institute) have been a popular choice. For higher-
K. Myrberg and A. Lehmann
Fig. 2.13 Average barotropic currents for 1992–1995 (cm/s) with the flow stability contours
(Lehmann and Hinrichsen 2000)
late 1980s. Over shorter periods (months), there is evidence that water movements
may take alternative paths as compared to the regular spreading patterns.
As seen even from this very brief summary, the number and variety of present
models and applications for the Baltic Sea is large. The reader is referred to the
review (Omstedt et al. 2004) and books (Feistel et al. 2008; BACC Author Team
2008; Leppäranta and Myrberg 2009) for further details in Baltic Sea circulation
modelling.
Today’s 3D numerical modelling in the Baltic Sea (incl. the examples presented
before) is typically based on the horizontal resolution of 1–5 km and a vertical structure described by 20–100 layers. In local applications (Zhurbas et al. 2008a, 2008b;
Andrejev et al. 2010; Lu et al. 2012) even higher resolutions are often needed. For
relatively low-resolution simulations targeted to model validation and intercomparisons (Myrberg et al. 2010) and to the identification of long-term changes (e.g., Myrberg and Andrejev 2006; Meier 2006, 2007; Lehmann et al. 2011), the properly adjusted geostrophic wind data (e.g., the gridded meteorological data by the Swedish
Meteorological and Hydrological Institute) have been a popular choice. For higher-