

406
J. Murawski and J. Woge Nielsen
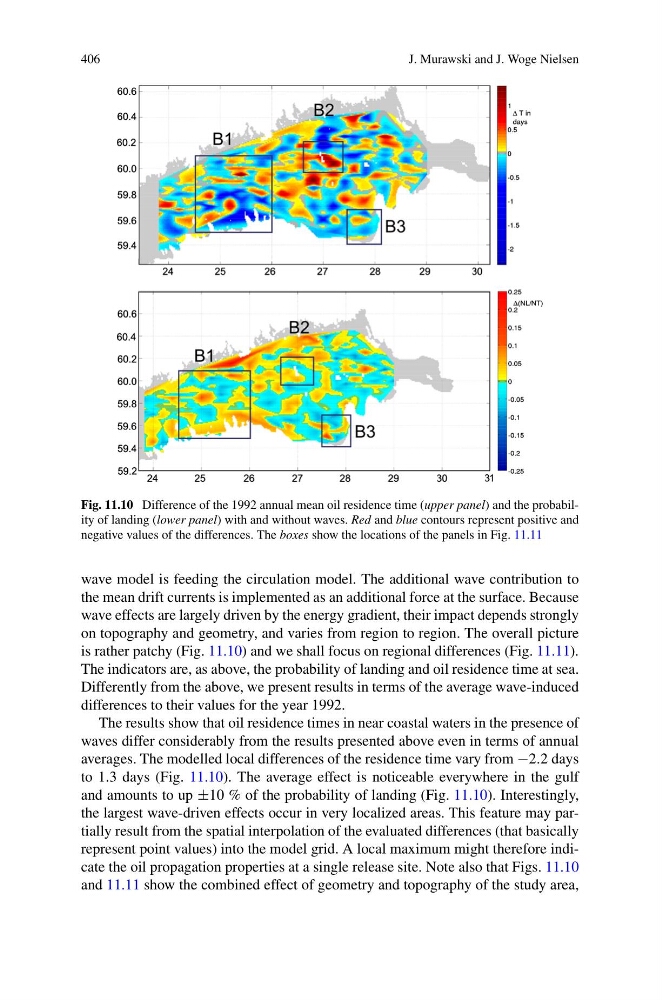
Fig. 11.10 Difference of the 1992 annual mean oil residence time (upper panel) and the probability of landing (lower panel) with and without waves. Red and blue contours represent positive and
negative values of the differences. The boxes show the locations of the panels in Fig. 11.11
wave model is feeding the circulation model. The additional wave contribution to
the mean drift currents is implemented as an additional force at the surface. Because
wave effects are largely driven by the energy gradient, their impact depends strongly
on topography and geometry, and varies from region to region. The overall picture
is rather patchy (Fig. 11.10) and we shall focus on regional differences (Fig. 11.11).
The indicators are, as above, the probability of landing and oil residence time at sea.
Differently from the above, we present results in terms of the average wave-induced
differences to their values for the year 1992.
The results show that oil residence times in near coastal waters in the presence of
waves differ considerably from the results presented above even in terms of annual
averages. The modelled local differences of the residence time vary from −2.2 days
to 1.3 days (Fig. 11.10). The average effect is noticeable everywhere in the gulf
and amounts to up ±10 % of the probability of landing (Fig. 11.10). Interestingly,
the largest wave-driven effects occur in very localized areas. This feature may partially result from the spatial interpolation of the evaluated differences (that basically
represent point values) into the model grid. A local maximum might therefore indicate the oil propagation properties at a single release site. Note also that Figs. 11.10
and 11.11 show the combined effect of geometry and topography of the study area,
J. Murawski and J. Woge Nielsen
Fig. 11.10 Difference of the 1992 annual mean oil residence time (upper panel) and the probability of landing (lower panel) with and without waves. Red and blue contours represent positive and
negative values of the differences. The boxes show the locations of the panels in Fig. 11.11
wave model is feeding the circulation model. The additional wave contribution to
the mean drift currents is implemented as an additional force at the surface. Because
wave effects are largely driven by the energy gradient, their impact depends strongly
on topography and geometry, and varies from region to region. The overall picture
is rather patchy (Fig. 11.10) and we shall focus on regional differences (Fig. 11.11).
The indicators are, as above, the probability of landing and oil residence time at sea.
Differently from the above, we present results in terms of the average wave-induced
differences to their values for the year 1992.
The results show that oil residence times in near coastal waters in the presence of
waves differ considerably from the results presented above even in terms of annual
averages. The modelled local differences of the residence time vary from −2.2 days
to 1.3 days (Fig. 11.10). The average effect is noticeable everywhere in the gulf
and amounts to up ±10 % of the probability of landing (Fig. 11.10). Interestingly,
the largest wave-driven effects occur in very localized areas. This feature may partially result from the spatial interpolation of the evaluated differences (that basically
represent point values) into the model grid. A local maximum might therefore indicate the oil propagation properties at a single release site. Note also that Figs. 11.10
and 11.11 show the combined effect of geometry and topography of the study area,