

11 Applications of an Oil Drift and Fate Model for Fairway Design
387
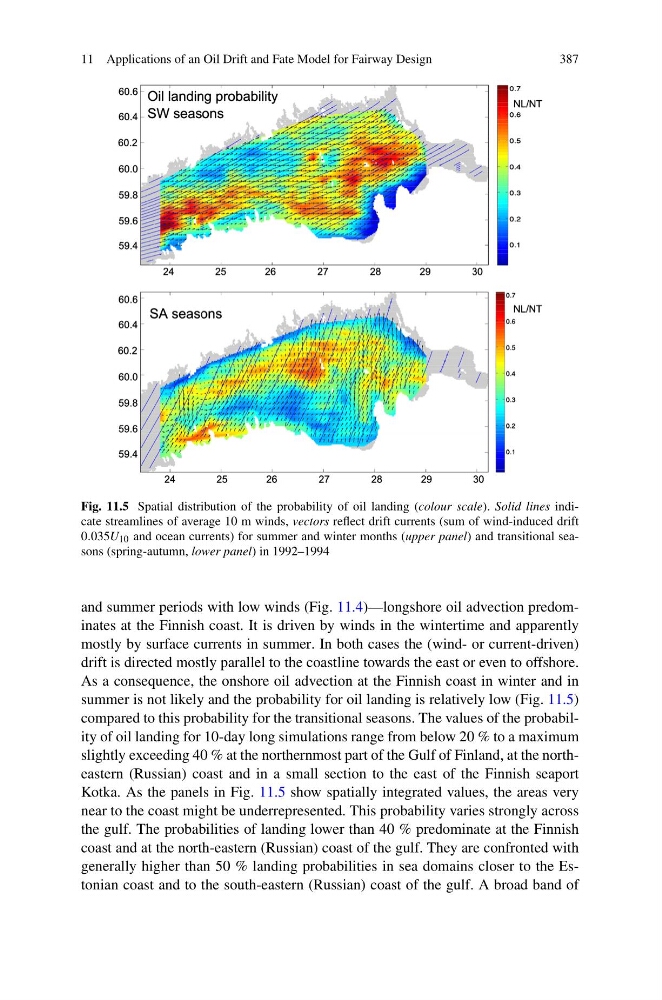
Fig. 11.5 Spatial distribution of the probability of oil landing (colour scale). Solid lines indicate streamlines of average 10 m winds, vectors reflect drift currents (sum of wind-induced drift
0.035U 10 and ocean currents) for summer and winter months (upper panel) and transitional seasons (spring-autumn, lower panel) in 1992–1994
and summer periods with low winds (Fig. 11.4)—longshore oil advection predominates at the Finnish coast. It is driven by winds in the wintertime and apparently
mostly by surface currents in summer. In both cases the (wind- or current-driven)
drift is directed mostly parallel to the coastline towards the east or even to offshore.
As a consequence, the onshore oil advection at the Finnish coast in winter and in
summer is not likely and the probability for oil landing is relatively low (Fig. 11.5)
compared to this probability for the transitional seasons. The values of the probability of oil landing for 10-day long simulations range from below 20 % to a maximum
slightly exceeding 40 % at the northernmost part of the Gulf of Finland, at the northeastern (Russian) coast and in a small section to the east of the Finnish seaport
Kotka. As the panels in Fig. 11.5 show spatially integrated values, the areas very
near to the coast might be underrepresented. This probability varies strongly across
the gulf. The probabilities of landing lower than 40 % predominate at the Finnish
coast and at the north-eastern (Russian) coast of the gulf. They are confronted with
generally higher than 50 % landing probabilities in sea domains closer to the Estonian coast and to the south-eastern (Russian) coast of the gulf. A broad band of
387
Fig. 11.5 Spatial distribution of the probability of oil landing (colour scale). Solid lines indicate streamlines of average 10 m winds, vectors reflect drift currents (sum of wind-induced drift
0.035U 10 and ocean currents) for summer and winter months (upper panel) and transitional seasons (spring-autumn, lower panel) in 1992–1994
and summer periods with low winds (Fig. 11.4)—longshore oil advection predominates at the Finnish coast. It is driven by winds in the wintertime and apparently
mostly by surface currents in summer. In both cases the (wind- or current-driven)
drift is directed mostly parallel to the coastline towards the east or even to offshore.
As a consequence, the onshore oil advection at the Finnish coast in winter and in
summer is not likely and the probability for oil landing is relatively low (Fig. 11.5)
compared to this probability for the transitional seasons. The values of the probability of oil landing for 10-day long simulations range from below 20 % to a maximum
slightly exceeding 40 % at the northernmost part of the Gulf of Finland, at the northeastern (Russian) coast and in a small section to the east of the Finnish seaport
Kotka. As the panels in Fig. 11.5 show spatially integrated values, the areas very
near to the coast might be underrepresented. This probability varies strongly across
the gulf. The probabilities of landing lower than 40 % predominate at the Finnish
coast and at the north-eastern (Russian) coast of the gulf. They are confronted with
generally higher than 50 % landing probabilities in sea domains closer to the Estonian coast and to the south-eastern (Russian) coast of the gulf. A broad band of