

350
T. Soomere
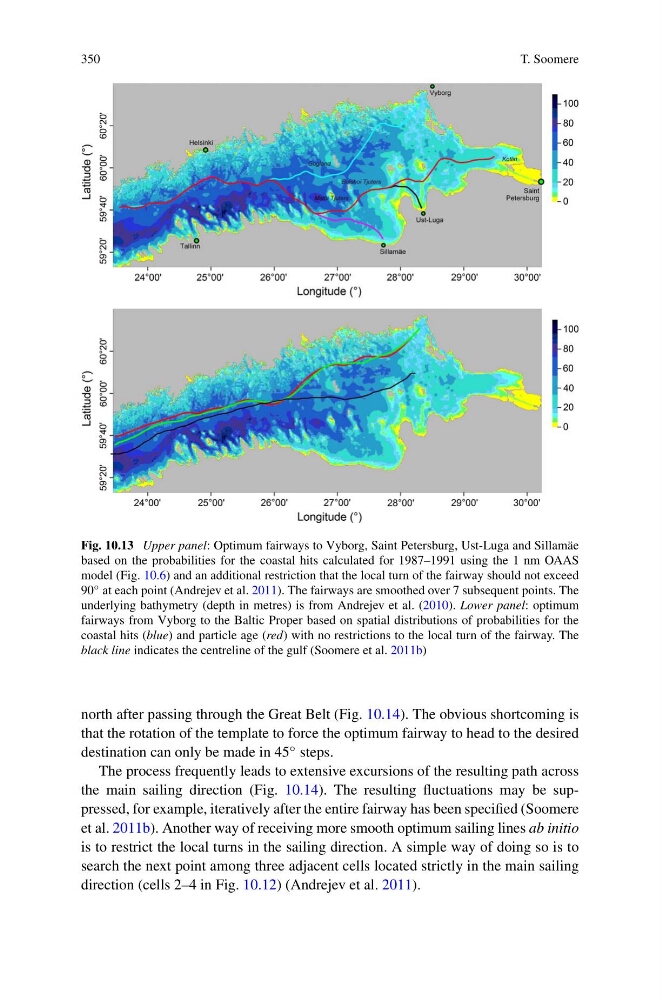
Fig. 10.13 Upper panel: Optimum fairways to Vyborg, Saint Petersburg, Ust-Luga and Sillamäe
based on the probabilities for the coastal hits calculated for 1987–1991 using the 1 nm OAAS
model (Fig. 10.6) and an additional restriction that the local turn of the fairway should not exceed
90 ◦ at each point (Andrejev et al. 2011). The fairways are smoothed over 7 subsequent points. The
underlying bathymetry (depth in metres) is from Andrejev et al. (2010). Lower panel: optimum
fairways from Vyborg to the Baltic Proper based on spatial distributions of probabilities for the
coastal hits (blue) and particle age (red) with no restrictions to the local turn of the fairway. The
black line indicates the centreline of the gulf (Soomere et al. 2011b)
north after passing through the Great Belt (Fig. 10.14). The obvious shortcoming is
that the rotation of the template to force the optimum fairway to head to the desired
destination can only be made in 45 ◦ steps.
The process frequently leads to extensive excursions of the resulting path across
the main sailing direction (Fig. 10.14). The resulting fluctuations may be suppressed, for example, iteratively after the entire fairway has been specified (Soomere
et al. 2011b). Another way of receiving more smooth optimum sailing lines ab initio
is to restrict the local turns in the sailing direction. A simple way of doing so is to
search the next point among three adjacent cells located strictly in the main sailing
direction (cells 2–4 in Fig. 10.12) (Andrejev et al. 2011).
T. Soomere
Fig. 10.13 Upper panel: Optimum fairways to Vyborg, Saint Petersburg, Ust-Luga and Sillamäe
based on the probabilities for the coastal hits calculated for 1987–1991 using the 1 nm OAAS
model (Fig. 10.6) and an additional restriction that the local turn of the fairway should not exceed
90 ◦ at each point (Andrejev et al. 2011). The fairways are smoothed over 7 subsequent points. The
underlying bathymetry (depth in metres) is from Andrejev et al. (2010). Lower panel: optimum
fairways from Vyborg to the Baltic Proper based on spatial distributions of probabilities for the
coastal hits (blue) and particle age (red) with no restrictions to the local turn of the fairway. The
black line indicates the centreline of the gulf (Soomere et al. 2011b)
north after passing through the Great Belt (Fig. 10.14). The obvious shortcoming is
that the rotation of the template to force the optimum fairway to head to the desired
destination can only be made in 45 ◦ steps.
The process frequently leads to extensive excursions of the resulting path across
the main sailing direction (Fig. 10.14). The resulting fluctuations may be suppressed, for example, iteratively after the entire fairway has been specified (Soomere
et al. 2011b). Another way of receiving more smooth optimum sailing lines ab initio
is to restrict the local turns in the sailing direction. A simple way of doing so is to
search the next point among three adjacent cells located strictly in the main sailing
direction (cells 2–4 in Fig. 10.12) (Andrejev et al. 2011).