

310
T. Soomere
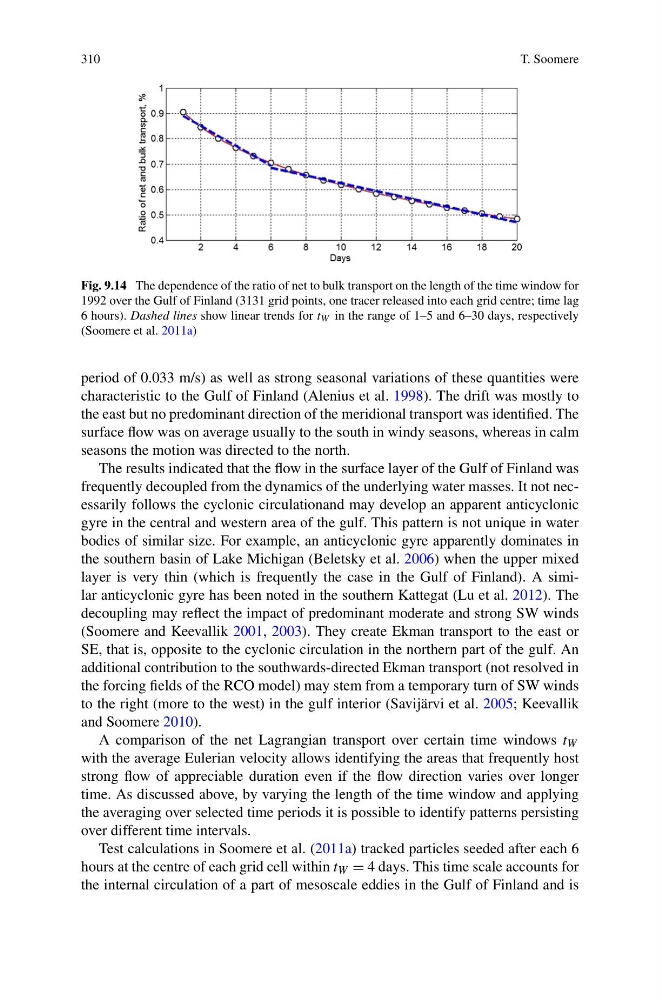
Fig. 9.14 The dependence of the ratio of net to bulk transport on the length of the time window for
1992 over the Gulf of Finland (3131 grid points, one tracer released into each grid centre; time lag
6 hours). Dashed lines show linear trends for t W in the range of 1–5 and 6–30 days, respectively
(Soomere et al. 2011a)
period of 0.033 m/s) as well as strong seasonal variations of these quantities were
characteristic to the Gulf of Finland (Alenius et al. 1998). The drift was mostly to
the east but no predominant direction of the meridional transport was identified. The
surface flow was on average usually to the south in windy seasons, whereas in calm
seasons the motion was directed to the north.
The results indicated that the flow in the surface layer of the Gulf of Finland was
frequently decoupled from the dynamics of the underlying water masses. It not necessarily follows the cyclonic circulationand may develop an apparent anticyclonic
gyre in the central and western area of the gulf. This pattern is not unique in water
bodies of similar size. For example, an anticyclonic gyre apparently dominates in
the southern basin of Lake Michigan (Beletsky et al. 2006) when the upper mixed
layer is very thin (which is frequently the case in the Gulf of Finland). A similar anticyclonic gyre has been noted in the southern Kattegat (Lu et al. 2012). The
decoupling may reflect the impact of predominant moderate and strong SW winds
(Soomere and Keevallik 2001, 2003). They create Ekman transport to the east or
SE, that is, opposite to the cyclonic circulation in the northern part of the gulf. An
additional contribution to the southwards-directed Ekman transport (not resolved in
the forcing fields of the RCO model) may stem from a temporary turn of SW winds
to the right (more to the west) in the gulf interior (Savijärvi et al. 2005; Keevallik
and Soomere 2010).
A comparison of the net Lagrangian transport over certain time windows t W
with the average Eulerian velocity allows identifying the areas that frequently host
strong flow of appreciable duration even if the flow direction varies over longer
time. As discussed above, by varying the length of the time window and applying
the averaging over selected time periods it is possible to identify patterns persisting
over different time intervals.
Test calculations in Soomere et al. (2011a) tracked particles seeded after each 6
hours at the centre of each grid cell within t W = 4 days. This time scale accounts for
the internal circulation of a part of mesoscale eddies in the Gulf of Finland and is
T. Soomere
Fig. 9.14 The dependence of the ratio of net to bulk transport on the length of the time window for
1992 over the Gulf of Finland (3131 grid points, one tracer released into each grid centre; time lag
6 hours). Dashed lines show linear trends for t W in the range of 1–5 and 6–30 days, respectively
(Soomere et al. 2011a)
period of 0.033 m/s) as well as strong seasonal variations of these quantities were
characteristic to the Gulf of Finland (Alenius et al. 1998). The drift was mostly to
the east but no predominant direction of the meridional transport was identified. The
surface flow was on average usually to the south in windy seasons, whereas in calm
seasons the motion was directed to the north.
The results indicated that the flow in the surface layer of the Gulf of Finland was
frequently decoupled from the dynamics of the underlying water masses. It not necessarily follows the cyclonic circulationand may develop an apparent anticyclonic
gyre in the central and western area of the gulf. This pattern is not unique in water
bodies of similar size. For example, an anticyclonic gyre apparently dominates in
the southern basin of Lake Michigan (Beletsky et al. 2006) when the upper mixed
layer is very thin (which is frequently the case in the Gulf of Finland). A similar anticyclonic gyre has been noted in the southern Kattegat (Lu et al. 2012). The
decoupling may reflect the impact of predominant moderate and strong SW winds
(Soomere and Keevallik 2001, 2003). They create Ekman transport to the east or
SE, that is, opposite to the cyclonic circulation in the northern part of the gulf. An
additional contribution to the southwards-directed Ekman transport (not resolved in
the forcing fields of the RCO model) may stem from a temporary turn of SW winds
to the right (more to the west) in the gulf interior (Savijärvi et al. 2005; Keevallik
and Soomere 2010).
A comparison of the net Lagrangian transport over certain time windows t W
with the average Eulerian velocity allows identifying the areas that frequently host
strong flow of appreciable duration even if the flow direction varies over longer
time. As discussed above, by varying the length of the time window and applying
the averaging over selected time periods it is possible to identify patterns persisting
over different time intervals.
Test calculations in Soomere et al. (2011a) tracked particles seeded after each 6
hours at the centre of each grid cell within t W = 4 days. This time scale accounts for
the internal circulation of a part of mesoscale eddies in the Gulf of Finland and is