

272
J. Kjellsson et al.
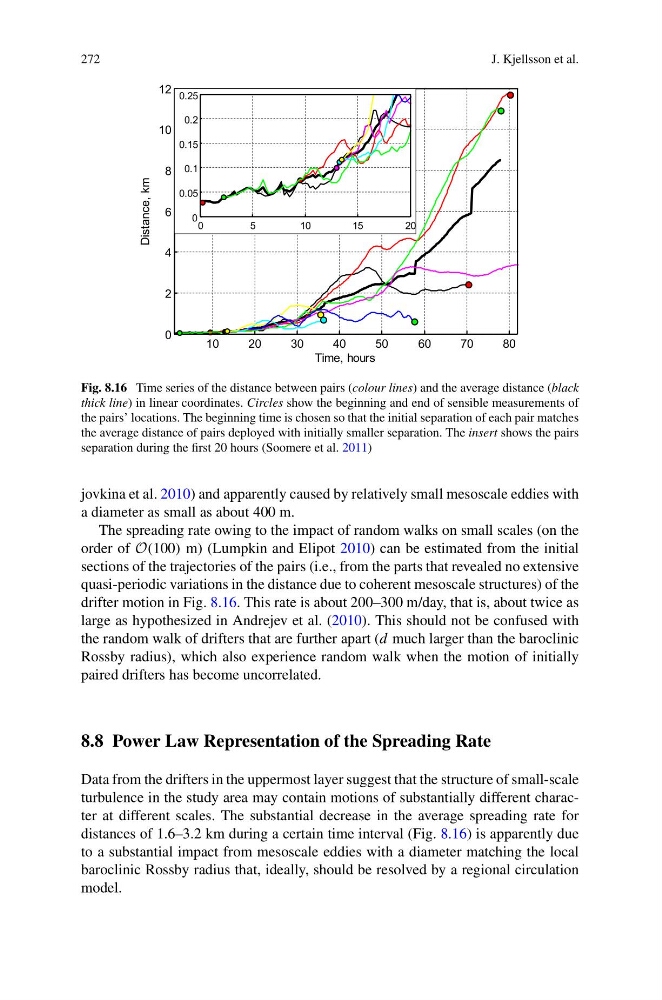
Fig. 8.16 Time series of the distance between pairs (colour lines) and the average distance (black
thick line) in linear coordinates. Circles show the beginning and end of sensible measurements of
the pairs’ locations. The beginning time is chosen so that the initial separation of each pair matches
the average distance of pairs deployed with initially smaller separation. The insert shows the pairs
separation during the first 20 hours (Soomere et al. 2011)
jovkina et al. 2010) and apparently caused by relatively small mesoscale eddies with
a diameter as small as about 400 m.
The spreading rate owing to the impact of random walks on small scales (on the
order of O(100) m) (Lumpkin and Elipot 2010) can be estimated from the initial
sections of the trajectories of the pairs (i.e., from the parts that revealed no extensive
quasi-periodic variations in the distance due to coherent mesoscale structures) of the
drifter motion in Fig. 8.16. This rate is about 200–300 m/day, that is, about twice as
large as hypothesized in Andrejev et al. (2010). This should not be confused with
the random walk of drifters that are further apart (d much larger than the baroclinic
Rossby radius), which also experience random walk when the motion of initially
paired drifters has become uncorrelated.
8.8 Power Law Representation of the Spreading Rate
Data from the drifters in the uppermost layer suggest that the structure of small-scale
turbulence in the study area may contain motions of substantially different character at different scales. The substantial decrease in the average spreading rate for
distances of 1.6–3.2 km during a certain time interval (Fig. 8.16) is apparently due
to a substantial impact from mesoscale eddies with a diameter matching the local
baroclinic Rossby radius that, ideally, should be resolved by a regional circulation
model.
J. Kjellsson et al.
Fig. 8.16 Time series of the distance between pairs (colour lines) and the average distance (black
thick line) in linear coordinates. Circles show the beginning and end of sensible measurements of
the pairs’ locations. The beginning time is chosen so that the initial separation of each pair matches
the average distance of pairs deployed with initially smaller separation. The insert shows the pairs
separation during the first 20 hours (Soomere et al. 2011)
jovkina et al. 2010) and apparently caused by relatively small mesoscale eddies with
a diameter as small as about 400 m.
The spreading rate owing to the impact of random walks on small scales (on the
order of O(100) m) (Lumpkin and Elipot 2010) can be estimated from the initial
sections of the trajectories of the pairs (i.e., from the parts that revealed no extensive
quasi-periodic variations in the distance due to coherent mesoscale structures) of the
drifter motion in Fig. 8.16. This rate is about 200–300 m/day, that is, about twice as
large as hypothesized in Andrejev et al. (2010). This should not be confused with
the random walk of drifters that are further apart (d much larger than the baroclinic
Rossby radius), which also experience random walk when the motion of initially
paired drifters has become uncorrelated.
8.8 Power Law Representation of the Spreading Rate
Data from the drifters in the uppermost layer suggest that the structure of small-scale
turbulence in the study area may contain motions of substantially different character at different scales. The substantial decrease in the average spreading rate for
distances of 1.6–3.2 km during a certain time interval (Fig. 8.16) is apparently due
to a substantial impact from mesoscale eddies with a diameter matching the local
baroclinic Rossby radius that, ideally, should be resolved by a regional circulation
model.