

8 Trajectories and Spreading of Observed and Simulated Drifters in the Baltic Sea
271
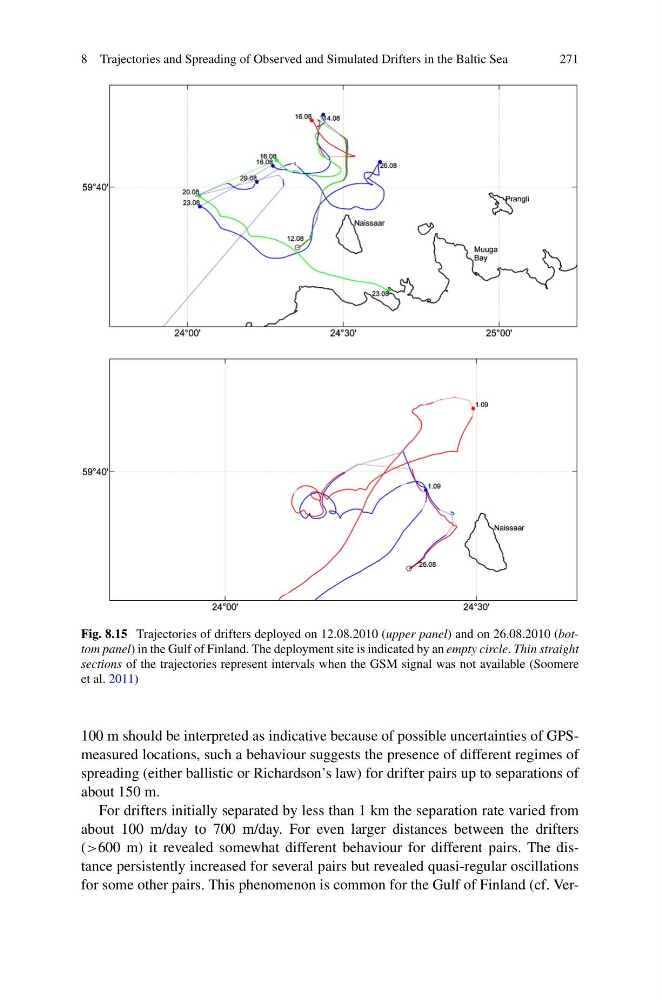
Fig. 8.15 Trajectories of drifters deployed on 12.08.2010 (upper panel) and on 26.08.2010 (bottom panel) in the Gulf of Finland. The deployment site is indicated by an empty circle. Thin straight
sections of the trajectories represent intervals when the GSM signal was not available (Soomere
et al. 2011)
100 m should be interpreted as indicative because of possible uncertainties of GPSmeasured locations, such a behaviour suggests the presence of different regimes of
spreading (either ballistic or Richardson’s law) for drifter pairs up to separations of
about 150 m.
For drifters initially separated by less than 1 km the separation rate varied from
about 100 m/day to 700 m/day. For even larger distances between the drifters
(>600 m) it revealed somewhat different behaviour for different pairs. The distance persistently increased for several pairs but revealed quasi-regular oscillations
for some other pairs. This phenomenon is common for the Gulf of Finland (cf. Ver-
271
Fig. 8.15 Trajectories of drifters deployed on 12.08.2010 (upper panel) and on 26.08.2010 (bottom panel) in the Gulf of Finland. The deployment site is indicated by an empty circle. Thin straight
sections of the trajectories represent intervals when the GSM signal was not available (Soomere
et al. 2011)
100 m should be interpreted as indicative because of possible uncertainties of GPSmeasured locations, such a behaviour suggests the presence of different regimes of
spreading (either ballistic or Richardson’s law) for drifter pairs up to separations of
about 150 m.
For drifters initially separated by less than 1 km the separation rate varied from
about 100 m/day to 700 m/day. For even larger distances between the drifters
(>600 m) it revealed somewhat different behaviour for different pairs. The distance persistently increased for several pairs but revealed quasi-regular oscillations
for some other pairs. This phenomenon is common for the Gulf of Finland (cf. Ver-