

268
J. Kjellsson et al.
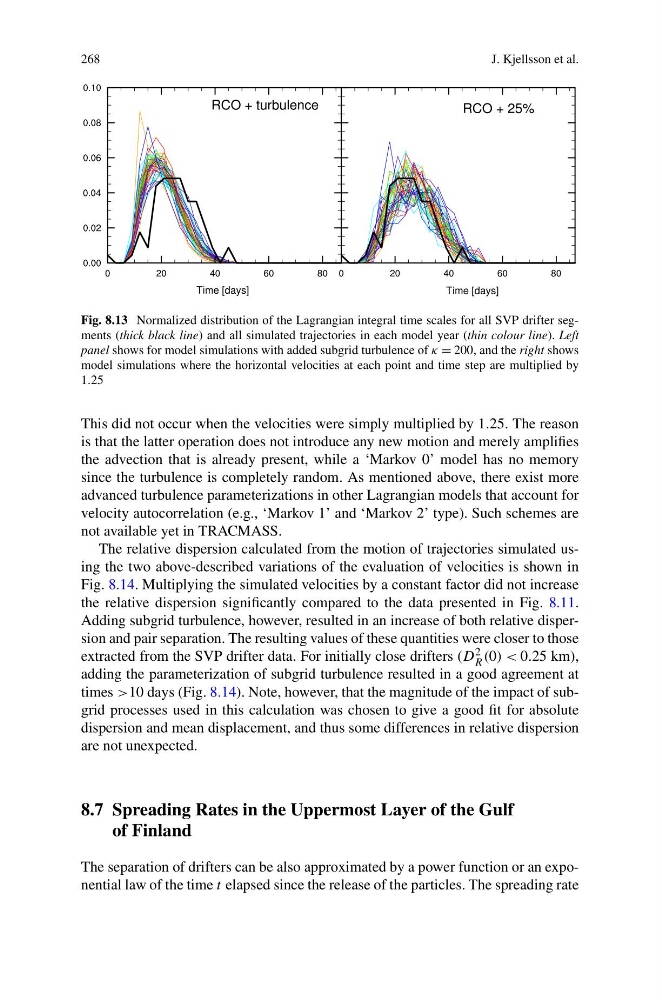
Fig. 8.13 Normalized distribution of the Lagrangian integral time scales for all SVP drifter segments (thick black line) and all simulated trajectories in each model year (thin colour line). Left
panel shows for model simulations with added subgrid turbulence of κ = 200, and the right shows
model simulations where the horizontal velocities at each point and time step are multiplied by
1.25
This did not occur when the velocities were simply multiplied by 1.25. The reason
is that the latter operation does not introduce any new motion and merely amplifies
the advection that is already present, while a ‘Markov 0’ model has no memory
since the turbulence is completely random. As mentioned above, there exist more
advanced turbulence parameterizations in other Lagrangian models that account for
velocity autocorrelation (e.g., ‘Markov 1’ and ‘Markov 2’ type). Such schemes are
not available yet in TRACMASS.
The relative dispersion calculated from the motion of trajectories simulated using the two above-described variations of the evaluation of velocities is shown in
Fig. 8.14. Multiplying the simulated velocities by a constant factor did not increase
the relative dispersion significantly compared to the data presented in Fig. 8.11.
Adding subgrid turbulence, however, resulted in an increase of both relative dispersion and pair separation. The resulting values of these quantities were closer to those
extracted from the SVP drifter data. For initially close drifters (D 2
R (0) < 0.25 km),
adding the parameterization of subgrid turbulence resulted in a good agreement at
times >10 days (Fig. 8.14). Note, however, that the magnitude of the impact of subgrid processes used in this calculation was chosen to give a good fit for absolute
dispersion and mean displacement, and thus some differences in relative dispersion
are not unexpected.
8.7 Spreading Rates in the Uppermost Layer of the Gulf
of Finland
The separation of drifters can be also approximated by a power function or an exponential law of the time t elapsed since the release of the particles. The spreading rate
J. Kjellsson et al.
Fig. 8.13 Normalized distribution of the Lagrangian integral time scales for all SVP drifter segments (thick black line) and all simulated trajectories in each model year (thin colour line). Left
panel shows for model simulations with added subgrid turbulence of κ = 200, and the right shows
model simulations where the horizontal velocities at each point and time step are multiplied by
1.25
This did not occur when the velocities were simply multiplied by 1.25. The reason
is that the latter operation does not introduce any new motion and merely amplifies
the advection that is already present, while a ‘Markov 0’ model has no memory
since the turbulence is completely random. As mentioned above, there exist more
advanced turbulence parameterizations in other Lagrangian models that account for
velocity autocorrelation (e.g., ‘Markov 1’ and ‘Markov 2’ type). Such schemes are
not available yet in TRACMASS.
The relative dispersion calculated from the motion of trajectories simulated using the two above-described variations of the evaluation of velocities is shown in
Fig. 8.14. Multiplying the simulated velocities by a constant factor did not increase
the relative dispersion significantly compared to the data presented in Fig. 8.11.
Adding subgrid turbulence, however, resulted in an increase of both relative dispersion and pair separation. The resulting values of these quantities were closer to those
extracted from the SVP drifter data. For initially close drifters (D 2
R (0) < 0.25 km),
adding the parameterization of subgrid turbulence resulted in a good agreement at
times >10 days (Fig. 8.14). Note, however, that the magnitude of the impact of subgrid processes used in this calculation was chosen to give a good fit for absolute
dispersion and mean displacement, and thus some differences in relative dispersion
are not unexpected.
8.7 Spreading Rates in the Uppermost Layer of the Gulf
of Finland
The separation of drifters can be also approximated by a power function or an exponential law of the time t elapsed since the release of the particles. The spreading rate