

266
J. Kjellsson et al.
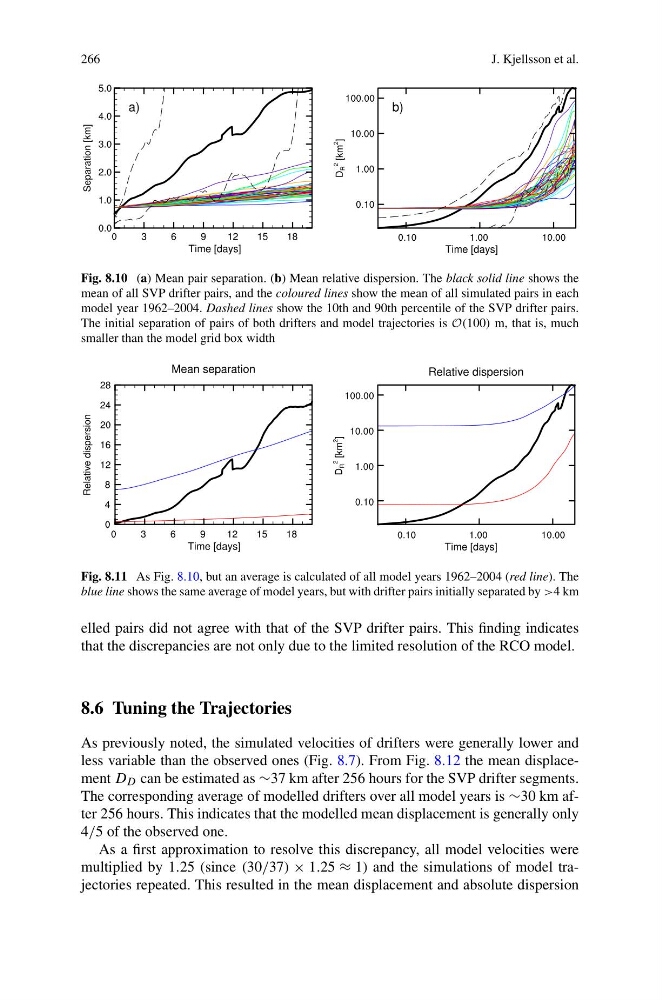
Fig. 8.10 (a) Mean pair separation. (b) Mean relative dispersion. The black solid line shows the
mean of all SVP drifter pairs, and the coloured lines show the mean of all simulated pairs in each
model year 1962–2004. Dashed lines show the 10th and 90th percentile of the SVP drifter pairs.
The initial separation of pairs of both drifters and model trajectories is O(100) m, that is, much
smaller than the model grid box width
Fig. 8.11 As Fig. 8.10, but an average is calculated of all model years 1962–2004 (red line). The
blue line shows the same average of model years, but with drifter pairs initially separated by >4 km
elled pairs did not agree with that of the SVP drifter pairs. This finding indicates
that the discrepancies are not only due to the limited resolution of the RCO model.
8.6 Tuning the Trajectories
As previously noted, the simulated velocities of drifters were generally lower and
less variable than the observed ones (Fig. 8.7). From Fig. 8.12 the mean displacement D D can be estimated as ∼37 km after 256 hours for the SVP drifter segments.
The corresponding average of modelled drifters over all model years is ∼30 km after 256 hours. This indicates that the modelled mean displacement is generally only
4/5 of the observed one.
As a first approximation to resolve this discrepancy, all model velocities were
multiplied by 1.25 (since (30/37) × 1.25 ≈ 1) and the simulations of model trajectories repeated. This resulted in the mean displacement and absolute dispersion
J. Kjellsson et al.
Fig. 8.10 (a) Mean pair separation. (b) Mean relative dispersion. The black solid line shows the
mean of all SVP drifter pairs, and the coloured lines show the mean of all simulated pairs in each
model year 1962–2004. Dashed lines show the 10th and 90th percentile of the SVP drifter pairs.
The initial separation of pairs of both drifters and model trajectories is O(100) m, that is, much
smaller than the model grid box width
Fig. 8.11 As Fig. 8.10, but an average is calculated of all model years 1962–2004 (red line). The
blue line shows the same average of model years, but with drifter pairs initially separated by >4 km
elled pairs did not agree with that of the SVP drifter pairs. This finding indicates
that the discrepancies are not only due to the limited resolution of the RCO model.
8.6 Tuning the Trajectories
As previously noted, the simulated velocities of drifters were generally lower and
less variable than the observed ones (Fig. 8.7). From Fig. 8.12 the mean displacement D D can be estimated as ∼37 km after 256 hours for the SVP drifter segments.
The corresponding average of modelled drifters over all model years is ∼30 km after 256 hours. This indicates that the modelled mean displacement is generally only
4/5 of the observed one.
As a first approximation to resolve this discrepancy, all model velocities were
multiplied by 1.25 (since (30/37) × 1.25 ≈ 1) and the simulations of model trajectories repeated. This resulted in the mean displacement and absolute dispersion