

242
K. Döös et al.
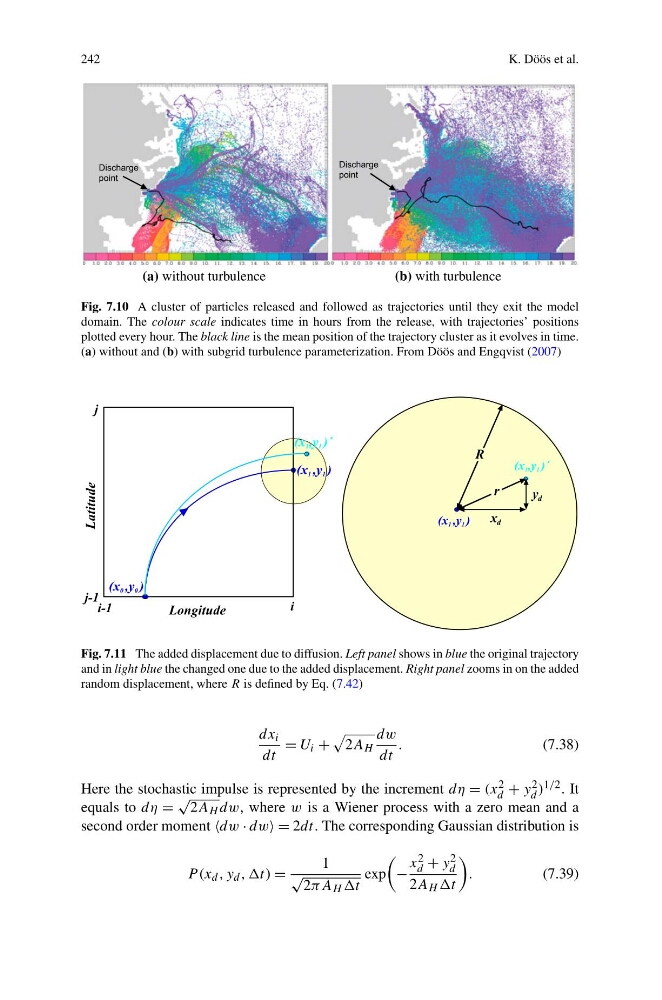
Fig. 7.10 A cluster of particles released and followed as trajectories until they exit the model
domain. The colour scale indicates time in hours from the release, with trajectories’ positions
plotted every hour. The black line is the mean position of the trajectory cluster as it evolves in time.
(a) without and (b) with subgrid turbulence parameterization. From Döös and Engqvist (2007)
Fig. 7.11 The added displacement due to diffusion. Left panel shows in blue the original trajectory
and in light blue the changed one due to the added displacement. Right panel zooms in on the added
random displacement, where R is defined by Eq. (7.42)
dx i
dt
= U i +
2A H
dw
dt
.
(7.38)
Here the stochastic impulse is represented by the increment dη = (x 2
d + y 2
d ) 1/2 . It
equals to dη =
√
2A H dw, where w is a Wiener process with a zero mean and a
second order moment dw · dw = 2dt. The corresponding Gaussian distribution is
P (x d , y d , ,t) =
1
√
2πA H t
exp
−
x 2
d + y 2
d
2A H t
.
(7.39)
K. Döös et al.
Fig. 7.10 A cluster of particles released and followed as trajectories until they exit the model
domain. The colour scale indicates time in hours from the release, with trajectories’ positions
plotted every hour. The black line is the mean position of the trajectory cluster as it evolves in time.
(a) without and (b) with subgrid turbulence parameterization. From Döös and Engqvist (2007)
Fig. 7.11 The added displacement due to diffusion. Left panel shows in blue the original trajectory
and in light blue the changed one due to the added displacement. Right panel zooms in on the added
random displacement, where R is defined by Eq. (7.42)
dx i
dt
= U i +
2A H
dw
dt
.
(7.38)
Here the stochastic impulse is represented by the increment dη = (x 2
d + y 2
d ) 1/2 . It
equals to dη =
√
2A H dw, where w is a Wiener process with a zero mean and a
second order moment dw · dw = 2dt. The corresponding Gaussian distribution is
P (x d , y d , ,t) =
1
√
2πA H t
exp
−
x 2
d + y 2
d
2A H t
.
(7.39)