

6 The Gulf of Finland
211
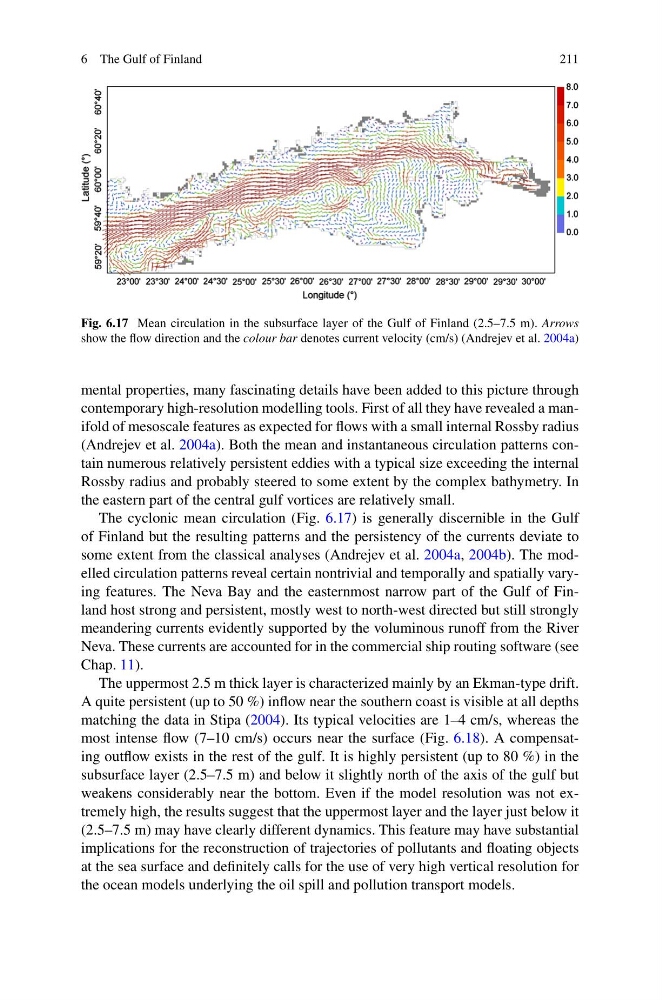
Fig. 6.17 Mean circulation in the subsurface layer of the Gulf of Finland (2.5–7.5 m). Arrows
show the flow direction and the colour bar denotes current velocity (cm/s) (Andrejev et al. 2004a)
mental properties, many fascinating details have been added to this picture through
contemporary high-resolution modelling tools. First of all they have revealed a manifold of mesoscale features as expected for flows with a small internal Rossby radius
(Andrejev et al. 2004a). Both the mean and instantaneous circulation patterns contain numerous relatively persistent eddies with a typical size exceeding the internal
Rossby radius and probably steered to some extent by the complex bathymetry. In
the eastern part of the central gulf vortices are relatively small.
The cyclonic mean circulation (Fig. 6.17) is generally discernible in the Gulf
of Finland but the resulting patterns and the persistency of the currents deviate to
some extent from the classical analyses (Andrejev et al. 2004a, 2004b). The modelled circulation patterns reveal certain nontrivial and temporally and spatially varying features. The Neva Bay and the easternmost narrow part of the Gulf of Finland host strong and persistent, mostly west to north-west directed but still strongly
meandering currents evidently supported by the voluminous runoff from the River
Neva. These currents are accounted for in the commercial ship routing software (see
Chap. 11).
The uppermost 2.5 m thick layer is characterized mainly by an Ekman-type drift.
A quite persistent (up to 50 %) inflow near the southern coast is visible at all depths
matching the data in Stipa (2004). Its typical velocities are 1–4 cm/s, whereas the
most intense flow (7–10 cm/s) occurs near the surface (Fig. 6.18). A compensating outflow exists in the rest of the gulf. It is highly persistent (up to 80 %) in the
subsurface layer (2.5–7.5 m) and below it slightly north of the axis of the gulf but
weakens considerably near the bottom. Even if the model resolution was not extremely high, the results suggest that the uppermost layer and the layer just below it
(2.5–7.5 m) may have clearly different dynamics. This feature may have substantial
implications for the reconstruction of trajectories of pollutants and floating objects
at the sea surface and definitely calls for the use of very high vertical resolution for
the ocean models underlying the oil spill and pollution transport models.
211
Fig. 6.17 Mean circulation in the subsurface layer of the Gulf of Finland (2.5–7.5 m). Arrows
show the flow direction and the colour bar denotes current velocity (cm/s) (Andrejev et al. 2004a)
mental properties, many fascinating details have been added to this picture through
contemporary high-resolution modelling tools. First of all they have revealed a manifold of mesoscale features as expected for flows with a small internal Rossby radius
(Andrejev et al. 2004a). Both the mean and instantaneous circulation patterns contain numerous relatively persistent eddies with a typical size exceeding the internal
Rossby radius and probably steered to some extent by the complex bathymetry. In
the eastern part of the central gulf vortices are relatively small.
The cyclonic mean circulation (Fig. 6.17) is generally discernible in the Gulf
of Finland but the resulting patterns and the persistency of the currents deviate to
some extent from the classical analyses (Andrejev et al. 2004a, 2004b). The modelled circulation patterns reveal certain nontrivial and temporally and spatially varying features. The Neva Bay and the easternmost narrow part of the Gulf of Finland host strong and persistent, mostly west to north-west directed but still strongly
meandering currents evidently supported by the voluminous runoff from the River
Neva. These currents are accounted for in the commercial ship routing software (see
Chap. 11).
The uppermost 2.5 m thick layer is characterized mainly by an Ekman-type drift.
A quite persistent (up to 50 %) inflow near the southern coast is visible at all depths
matching the data in Stipa (2004). Its typical velocities are 1–4 cm/s, whereas the
most intense flow (7–10 cm/s) occurs near the surface (Fig. 6.18). A compensating outflow exists in the rest of the gulf. It is highly persistent (up to 80 %) in the
subsurface layer (2.5–7.5 m) and below it slightly north of the axis of the gulf but
weakens considerably near the bottom. Even if the model resolution was not extremely high, the results suggest that the uppermost layer and the layer just below it
(2.5–7.5 m) may have clearly different dynamics. This feature may have substantial
implications for the reconstruction of trajectories of pollutants and floating objects
at the sea surface and definitely calls for the use of very high vertical resolution for
the ocean models underlying the oil spill and pollution transport models.