

156
E.V. Stanev and X. Lu
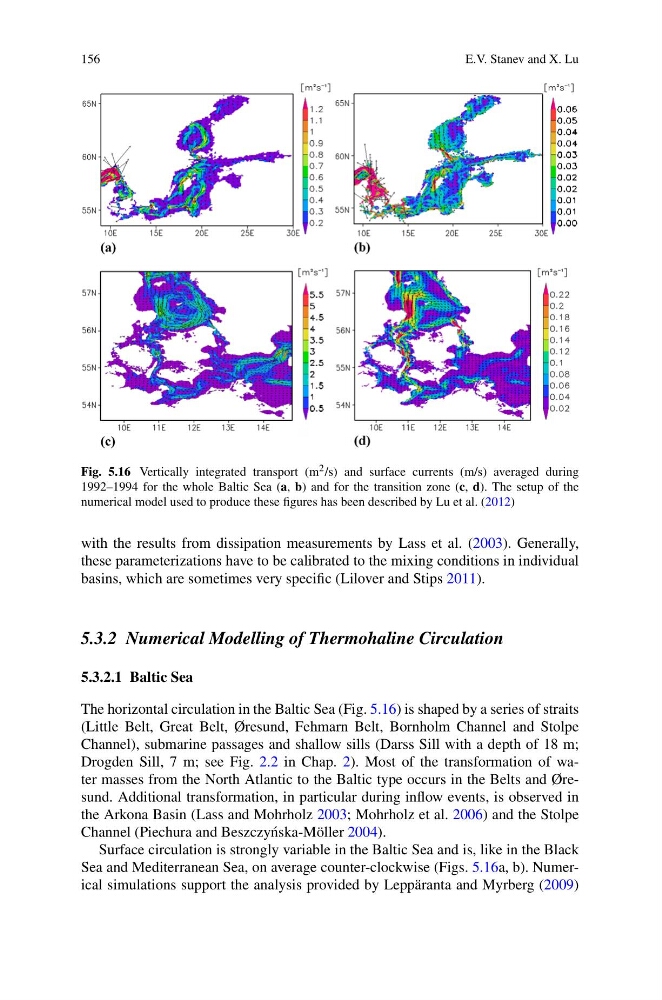
Fig. 5.16 Vertically integrated transport (m 2 /s) and surface currents (m/s) averaged during
1992–1994 for the whole Baltic Sea (a, b) and for the transition zone (c, d). The setup of the
numerical model used to produce these figures has been described by Lu et al. (2012)
with the results from dissipation measurements by Lass et al. (2003). Generally,
these parameterizations have to be calibrated to the mixing conditions in individual
basins, which are sometimes very specific (Lilover and Stips 2011).
5.3.2 Numerical Modelling of Thermohaline Circulation
5.3.2.1 Baltic Sea
The horizontal circulation in the Baltic Sea (Fig. 5.16) is shaped by a series of straits
(Little Belt, Great Belt, Øresund, Fehmarn Belt, Bornholm Channel and Stolpe
Channel), submarine passages and shallow sills (Darss Sill with a depth of 18 m;
Drogden Sill, 7 m; see Fig. 2.2 in Chap. 2). Most of the transformation of water masses from the North Atlantic to the Baltic type occurs in the Belts and Øresund. Additional transformation, in particular during inflow events, is observed in
the Arkona Basin (Lass and Mohrholz 2003; Mohrholz et al. 2006) and the Stolpe
Channel (Piechura and Beszczy´ nska-Möller 2004).
Surface circulation is strongly variable in the Baltic Sea and is, like in the Black
Sea and Mediterranean Sea, on average counter-clockwise (Figs. 5.16a, b). Numerical simulations support the analysis provided by Leppäranta and Myrberg (2009)
E.V. Stanev and X. Lu
Fig. 5.16 Vertically integrated transport (m 2 /s) and surface currents (m/s) averaged during
1992–1994 for the whole Baltic Sea (a, b) and for the transition zone (c, d). The setup of the
numerical model used to produce these figures has been described by Lu et al. (2012)
with the results from dissipation measurements by Lass et al. (2003). Generally,
these parameterizations have to be calibrated to the mixing conditions in individual
basins, which are sometimes very specific (Lilover and Stips 2011).
5.3.2 Numerical Modelling of Thermohaline Circulation
5.3.2.1 Baltic Sea
The horizontal circulation in the Baltic Sea (Fig. 5.16) is shaped by a series of straits
(Little Belt, Great Belt, Øresund, Fehmarn Belt, Bornholm Channel and Stolpe
Channel), submarine passages and shallow sills (Darss Sill with a depth of 18 m;
Drogden Sill, 7 m; see Fig. 2.2 in Chap. 2). Most of the transformation of water masses from the North Atlantic to the Baltic type occurs in the Belts and Øresund. Additional transformation, in particular during inflow events, is observed in
the Arkona Basin (Lass and Mohrholz 2003; Mohrholz et al. 2006) and the Stolpe
Channel (Piechura and Beszczy´ nska-Möller 2004).
Surface circulation is strongly variable in the Baltic Sea and is, like in the Black
Sea and Mediterranean Sea, on average counter-clockwise (Figs. 5.16a, b). Numerical simulations support the analysis provided by Leppäranta and Myrberg (2009)