

5 European Semi-enclosed Seas
157
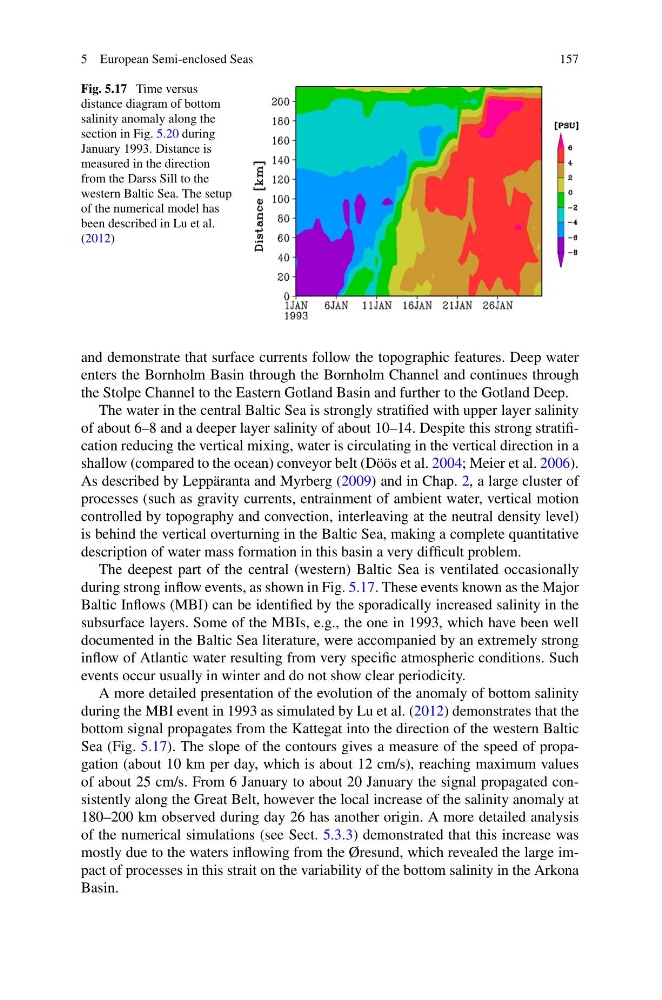
Fig. 5.17 Time versus
distance diagram of bottom
salinity anomaly along the
section in Fig. 5.20 during
January 1993. Distance is
measured in the direction
from the Darss Sill to the
western Baltic Sea. The setup
of the numerical model has
been described in Lu et al.
(2012)
and demonstrate that surface currents follow the topographic features. Deep water
enters the Bornholm Basin through the Bornholm Channel and continues through
the Stolpe Channel to the Eastern Gotland Basin and further to the Gotland Deep.
The water in the central Baltic Sea is strongly stratified with upper layer salinity
of about 6–8 and a deeper layer salinity of about 10–14. Despite this strong stratification reducing the vertical mixing, water is circulating in the vertical direction in a
shallow (compared to the ocean) conveyor belt (Döös et al. 2004; Meier et al. 2006).
As described by Leppäranta and Myrberg (2009) and in Chap. 2, a large cluster of
processes (such as gravity currents, entrainment of ambient water, vertical motion
controlled by topography and convection, interleaving at the neutral density level)
is behind the vertical overturning in the Baltic Sea, making a complete quantitative
description of water mass formation in this basin a very difficult problem.
The deepest part of the central (western) Baltic Sea is ventilated occasionally
during strong inflow events, as shown in Fig. 5.17. These events known as the Major
Baltic Inflows (MBI) can be identified by the sporadically increased salinity in the
subsurface layers. Some of the MBIs, e.g., the one in 1993, which have been well
documented in the Baltic Sea literature, were accompanied by an extremely strong
inflow of Atlantic water resulting from very specific atmospheric conditions. Such
events occur usually in winter and do not show clear periodicity.
A more detailed presentation of the evolution of the anomaly of bottom salinity
during the MBI event in 1993 as simulated by Lu et al. (2012) demonstrates that the
bottom signal propagates from the Kattegat into the direction of the western Baltic
Sea (Fig. 5.17). The slope of the contours gives a measure of the speed of propagation (about 10 km per day, which is about 12 cm/s), reaching maximum values
of about 25 cm/s. From 6 January to about 20 January the signal propagated consistently along the Great Belt, however the local increase of the salinity anomaly at
180–200 km observed during day 26 has another origin. A more detailed analysis
of the numerical simulations (see Sect. 5.3.3) demonstrated that this increase was
mostly due to the waters inflowing from the Øresund, which revealed the large impact of processes in this strait on the variability of the bottom salinity in the Arkona
Basin.
157
Fig. 5.17 Time versus
distance diagram of bottom
salinity anomaly along the
section in Fig. 5.20 during
January 1993. Distance is
measured in the direction
from the Darss Sill to the
western Baltic Sea. The setup
of the numerical model has
been described in Lu et al.
(2012)
and demonstrate that surface currents follow the topographic features. Deep water
enters the Bornholm Basin through the Bornholm Channel and continues through
the Stolpe Channel to the Eastern Gotland Basin and further to the Gotland Deep.
The water in the central Baltic Sea is strongly stratified with upper layer salinity
of about 6–8 and a deeper layer salinity of about 10–14. Despite this strong stratification reducing the vertical mixing, water is circulating in the vertical direction in a
shallow (compared to the ocean) conveyor belt (Döös et al. 2004; Meier et al. 2006).
As described by Leppäranta and Myrberg (2009) and in Chap. 2, a large cluster of
processes (such as gravity currents, entrainment of ambient water, vertical motion
controlled by topography and convection, interleaving at the neutral density level)
is behind the vertical overturning in the Baltic Sea, making a complete quantitative
description of water mass formation in this basin a very difficult problem.
The deepest part of the central (western) Baltic Sea is ventilated occasionally
during strong inflow events, as shown in Fig. 5.17. These events known as the Major
Baltic Inflows (MBI) can be identified by the sporadically increased salinity in the
subsurface layers. Some of the MBIs, e.g., the one in 1993, which have been well
documented in the Baltic Sea literature, were accompanied by an extremely strong
inflow of Atlantic water resulting from very specific atmospheric conditions. Such
events occur usually in winter and do not show clear periodicity.
A more detailed presentation of the evolution of the anomaly of bottom salinity
during the MBI event in 1993 as simulated by Lu et al. (2012) demonstrates that the
bottom signal propagates from the Kattegat into the direction of the western Baltic
Sea (Fig. 5.17). The slope of the contours gives a measure of the speed of propagation (about 10 km per day, which is about 12 cm/s), reaching maximum values
of about 25 cm/s. From 6 January to about 20 January the signal propagated consistently along the Great Belt, however the local increase of the salinity anomaly at
180–200 km observed during day 26 has another origin. A more detailed analysis
of the numerical simulations (see Sect. 5.3.3) demonstrated that this increase was
mostly due to the waters inflowing from the Øresund, which revealed the large impact of processes in this strait on the variability of the bottom salinity in the Arkona
Basin.