

CHAPTER 3 • Strategic Planning for Sustainable Development in Coastal Zone Regions
59
native development paths, focusing on potential technological change. The scenarios were first defined in terms of broad objectives like rates of GDP growth (a
high rate of iVo and a moderate rate of 5%) and the direction and rate of technological change. (Scenario SI continues present trends toward more efficient use of
resources and environmental protection; S2 includes much stronger resource conservation measures.) Then the IO case-study methodology (Duchin and Lange 1994) is
used to project and quantify future production technologies for the 15 sectors of the
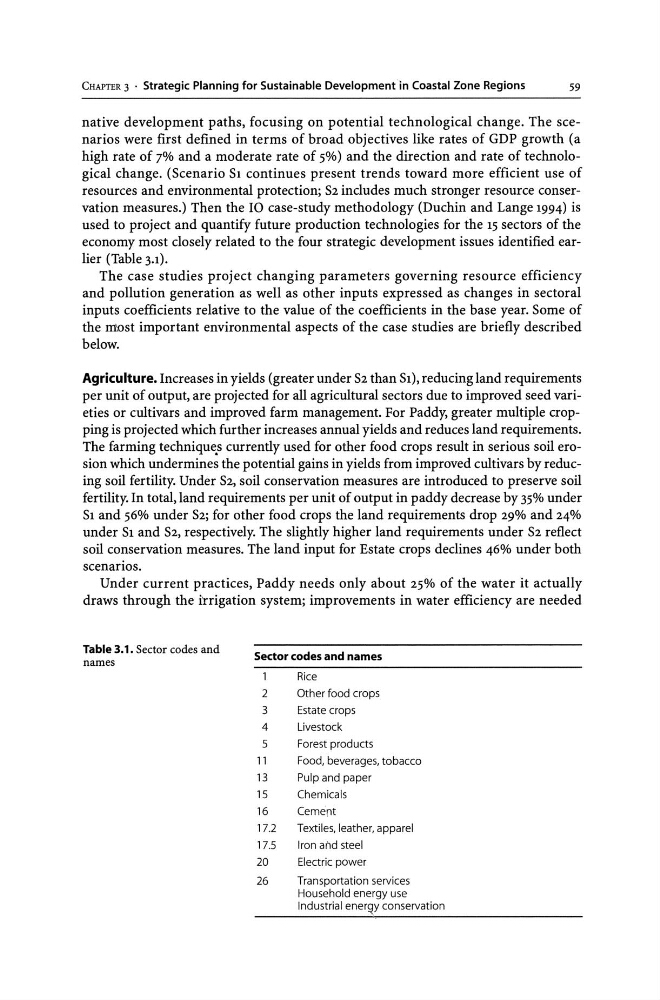
economy most closely related to the four strategic development issues identified earlier (Table 3-1).
The case studies project changing parameters governing resource efficiency
and pollution generation as well as other inputs expressed as changes in sectoral
inputs coefficients relative to the value of the coefficients in the base year. Some of
the ni\Ost important environmental aspects of the case studies are briefly described
below.
Agriculture. Increases in yields (greater under S2 than SI), reducing land requirements
per unit of output, are projected for all agricultural sectors due to improved seed varieties or cultivars and improved farm management. For Paddy, greater multiple cropping is projected which further increases annual yields and reduces land requirements.
The farming technique.s currently used for other food crops result in serious soil erosion which undermines the potential gains in yields from improved cultivars by reducing soil fertility. Under S2, soil conservation measures are introduced to preserve soil
fertility. In total, land requirements per unit of output in paddy decrease by 35% under
SI and 56% under S2; for other food crops the land requirements drop 29% and 24%
under SI and S2, respectively. The slightly higher land requirements under S2 reflect
soil conservation measures. The land input for Estate crops declines 46% under both
scenarios.
Under current practices, Paddy needs only about 25% of the water it actually
draws through the irrigation system; improvements in water efficiency are needed
Table 3.1. Sector codes and
names
Sector codes and names
Rice
2
Other food crops
3
Estate crops
4
Livestock
5
Forest products
11
Food, beverages, tobacco
13
Pulp and paper
15
Chemicals
16
Cement
17.2
Textiles, leather, apparel
17.5
Iron aM steel
20
Electric power
26
Transportation services
Household energy use
Industrial enerQY conservation
59
native development paths, focusing on potential technological change. The scenarios were first defined in terms of broad objectives like rates of GDP growth (a
high rate of iVo and a moderate rate of 5%) and the direction and rate of technological change. (Scenario SI continues present trends toward more efficient use of
resources and environmental protection; S2 includes much stronger resource conservation measures.) Then the IO case-study methodology (Duchin and Lange 1994) is
used to project and quantify future production technologies for the 15 sectors of the
economy most closely related to the four strategic development issues identified earlier (Table 3-1).
The case studies project changing parameters governing resource efficiency
and pollution generation as well as other inputs expressed as changes in sectoral
inputs coefficients relative to the value of the coefficients in the base year. Some of
the ni\Ost important environmental aspects of the case studies are briefly described
below.
Agriculture. Increases in yields (greater under S2 than SI), reducing land requirements
per unit of output, are projected for all agricultural sectors due to improved seed varieties or cultivars and improved farm management. For Paddy, greater multiple cropping is projected which further increases annual yields and reduces land requirements.
The farming technique.s currently used for other food crops result in serious soil erosion which undermines the potential gains in yields from improved cultivars by reducing soil fertility. Under S2, soil conservation measures are introduced to preserve soil
fertility. In total, land requirements per unit of output in paddy decrease by 35% under
SI and 56% under S2; for other food crops the land requirements drop 29% and 24%
under SI and S2, respectively. The slightly higher land requirements under S2 reflect
soil conservation measures. The land input for Estate crops declines 46% under both
scenarios.
Under current practices, Paddy needs only about 25% of the water it actually
draws through the irrigation system; improvements in water efficiency are needed
Table 3.1. Sector codes and
names
Sector codes and names
Rice
2
Other food crops
3
Estate crops
4
Livestock
5
Forest products
11
Food, beverages, tobacco
13
Pulp and paper
15
Chemicals
16
Cement
17.2
Textiles, leather, apparel
17.5
Iron aM steel
20
Electric power
26
Transportation services
Household energy use
Industrial enerQY conservation