

K. Takao . B. T. Bower
Costs with respect to recreation policy involve the capital costs of:
a converting the old-fashioned and inefficient port facilities to recreation uses,
b developing man-made beaches,
c installing recreational facilities, plus annual operation and maintenance costs
associated with these investments.
Table 18.9 shows the estimated costs for development and maintenance of
beaches, piers, and related facilities for water-oriented recreation under policies
R-l andR-2.
11l.3.6
Estimating Net Benefits
The results of estimating gross benefits and estimating costs, as described in the
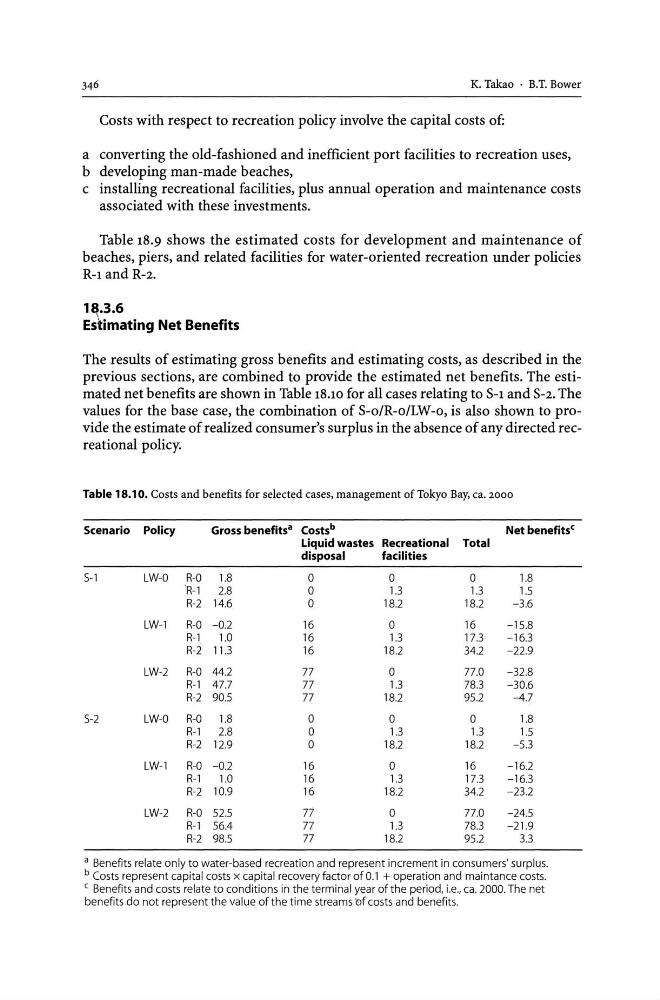
previous sections, are combined to provide the estimated net benefits. The estimated net benefits are shown in Table 18.10 for all cases relating to S-1 and S-2. The
values for the base case, the combination of S-o/R-o/LW-o, is also shown to provide the estimate of realized consumer's surplus in the absence of any directed recreational policy.
Table 18.10. Costs and benefits for selected cases, management of Tokyo Bay, ca. 2000
Scenario Policy
Gross benefits a Costs b
Net benefits C
Liquid wastes Recreational Total
disposal
facilities
5-1
LW-O
R-O
1.8
0
0
0
1.8
'R-l
2.8
0
1.3
1.3
1.5
R-2 14.6
0
18.2
18.2
-3.6
LW-l
R-O -0.2
16
0
16
-15.8
R-l
1.0
16
1.3
17.3
-16.3
R-2 11.3
16
18.2
34.2
-22.9
LW-2
R-O 44.2
77
0
77.0
-32.8
R-l 47.7
77
1.3
78.3
-30.6
R-2 90.5
77
18.2
95.2
-4.7
5-2
LW-O
R-O
1.8
0
0
0
1.8
R-l
2.8
0
1.3
1.3
1.5
R-2 12.9
0
18.2
18.2
-5.3
LW-l
R-O -0.2
16
0
16
-16.2
R-l
1.0
16
1.3
17.3
-16.3
R-2 10.9
16
18.2
34.2
-23.2
LW-2
R-O 52.5
77
0
77.0
-24.5
R-l 56.4
77.
1.3
78.3
-21.9
R-2 98.5
77
18.2
95.2
3.3
a Benefits relate only to water-based recreation and represent increment in consumers' surplus.
b Costs represent capital costs x capital recovery factor of 0.1 + operation and maintance costs.
C Benefits and costs relate to conditions in the terminal year of the period, i.e., ca. 2000. The net
benefits do not represent the value of the time streams bf costs and benefits.
Costs with respect to recreation policy involve the capital costs of:
a converting the old-fashioned and inefficient port facilities to recreation uses,
b developing man-made beaches,
c installing recreational facilities, plus annual operation and maintenance costs
associated with these investments.
Table 18.9 shows the estimated costs for development and maintenance of
beaches, piers, and related facilities for water-oriented recreation under policies
R-l andR-2.
11l.3.6
Estimating Net Benefits
The results of estimating gross benefits and estimating costs, as described in the
previous sections, are combined to provide the estimated net benefits. The estimated net benefits are shown in Table 18.10 for all cases relating to S-1 and S-2. The
values for the base case, the combination of S-o/R-o/LW-o, is also shown to provide the estimate of realized consumer's surplus in the absence of any directed recreational policy.
Table 18.10. Costs and benefits for selected cases, management of Tokyo Bay, ca. 2000
Scenario Policy
Gross benefits a Costs b
Net benefits C
Liquid wastes Recreational Total
disposal
facilities
5-1
LW-O
R-O
1.8
0
0
0
1.8
'R-l
2.8
0
1.3
1.3
1.5
R-2 14.6
0
18.2
18.2
-3.6
LW-l
R-O -0.2
16
0
16
-15.8
R-l
1.0
16
1.3
17.3
-16.3
R-2 11.3
16
18.2
34.2
-22.9
LW-2
R-O 44.2
77
0
77.0
-32.8
R-l 47.7
77
1.3
78.3
-30.6
R-2 90.5
77
18.2
95.2
-4.7
5-2
LW-O
R-O
1.8
0
0
0
1.8
R-l
2.8
0
1.3
1.3
1.5
R-2 12.9
0
18.2
18.2
-5.3
LW-l
R-O -0.2
16
0
16
-16.2
R-l
1.0
16
1.3
17.3
-16.3
R-2 10.9
16
18.2
34.2
-23.2
LW-2
R-O 52.5
77
0
77.0
-24.5
R-l 56.4
77.
1.3
78.3
-21.9
R-2 98.5
77
18.2
95.2
3.3
a Benefits relate only to water-based recreation and represent increment in consumers' surplus.
b Costs represent capital costs x capital recovery factor of 0.1 + operation and maintance costs.
C Benefits and costs relate to conditions in the terminal year of the period, i.e., ca. 2000. The net
benefits do not represent the value of the time streams bf costs and benefits.