

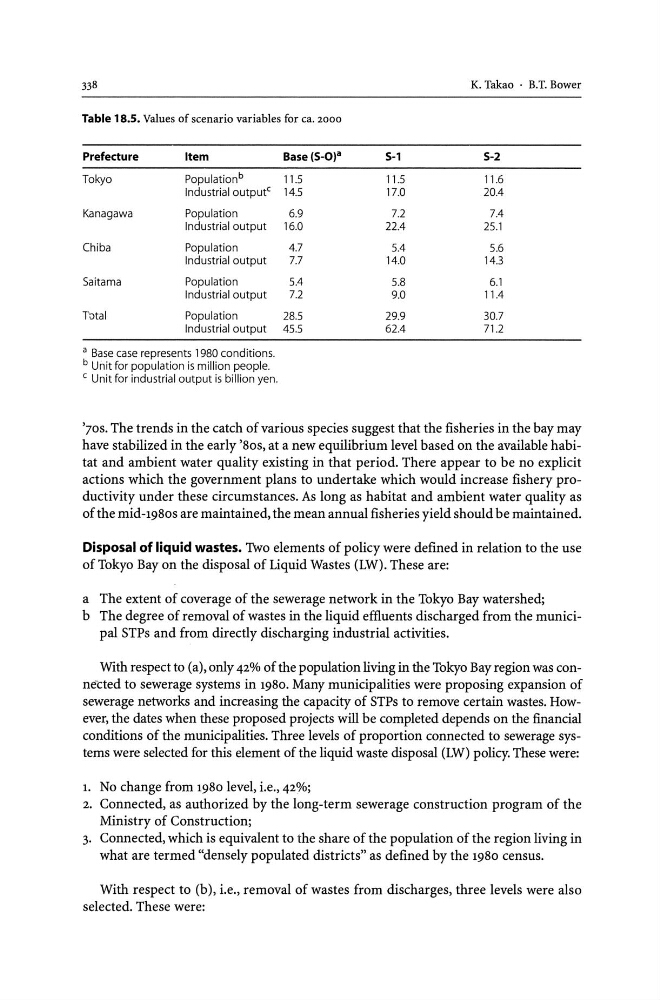
Table 18.5. Values of scenario variables for ca. 2000
Prefecture
Item
8ase(5-0)a
Tokyo
Population b
11.5
Industrial output C 14.5
Kanagawa
Population
6.9
Industrial output
16.0
Chiba
Population
4.7
Industrial output
7.7
5aitama
Population
5.4
Industrial output
7.2
Total
Population
28.5
Industrial output
45.5
a Base case represents 1980 conditions.
b Unit for population is million people.
C Unit for industrial output is billion yen.
5-1
11.5
17.0
7.2
22.4
5.4
14.0
5.8
9.0
29.9
62.4
K. Takao . B.T. Bower
5-2
11.6
20.4
7.4
25.1
5.6
14.3
6.1
11.4
30.7
71.2
'70S. The trends in the catch of various species suggest that the fisheries in the bay may
have stabilized in the early 'Bos, at a new equilibrium level based on the available habitat and ambient water quality existing in that period. There appear to be no explicit
actions which the government plans to undertake which would increase fishery productivity under these circumstances. As long as habitat and ambient water quality as
of the mid-19Bos are maintained, the mean annual fisheries yield should be maintained.
Disposal of liquid wastes. Two elements of policy were defined in relation to the use
of Tokyo Bay on the disposal of Liquid Wastes (LW). These are:
a The extent of coverage of the sewerage network in the Tokyo Bay watershed;
b The degree of removal of wastes in the liquid effluents discharged from the municipal STPs and from directly discharging industrial activities.
With respect to (a), only 42% of the population living in the Tokyo Bay region was conne'l:ted to sewerage systems in 19Bo. Many municipalities were proposing expansion of
sewerage networks and increasing the capacity of STPs to remove certain wastes. However, the dates when these proposed projects will be completed depends on the financial
conditions of the municipalities. Three levels of proportion connected to sewerage systems were selected for this element of the liquid waste disposal (LW) policy. These were:
1. No change from 19Bo level, i.e., 42%;
2. Connected, as authorized by the long-term sewerage construction program of the
Ministry of Construction;
3. Connected, which is equivalent to the share of the population of the region living in
what are termed "densely populated districts" as defined by the 19Bo census.
With respect to (b), i.e., removal of wastes from discharges, three levels were also
selected. These were:
Prefecture
Item
8ase(5-0)a
Tokyo
Population b
11.5
Industrial output C 14.5
Kanagawa
Population
6.9
Industrial output
16.0
Chiba
Population
4.7
Industrial output
7.7
5aitama
Population
5.4
Industrial output
7.2
Total
Population
28.5
Industrial output
45.5
a Base case represents 1980 conditions.
b Unit for population is million people.
C Unit for industrial output is billion yen.
5-1
11.5
17.0
7.2
22.4
5.4
14.0
5.8
9.0
29.9
62.4
K. Takao . B.T. Bower
5-2
11.6
20.4
7.4
25.1
5.6
14.3
6.1
11.4
30.7
71.2
'70S. The trends in the catch of various species suggest that the fisheries in the bay may
have stabilized in the early 'Bos, at a new equilibrium level based on the available habitat and ambient water quality existing in that period. There appear to be no explicit
actions which the government plans to undertake which would increase fishery productivity under these circumstances. As long as habitat and ambient water quality as
of the mid-19Bos are maintained, the mean annual fisheries yield should be maintained.
Disposal of liquid wastes. Two elements of policy were defined in relation to the use
of Tokyo Bay on the disposal of Liquid Wastes (LW). These are:
a The extent of coverage of the sewerage network in the Tokyo Bay watershed;
b The degree of removal of wastes in the liquid effluents discharged from the municipal STPs and from directly discharging industrial activities.
With respect to (a), only 42% of the population living in the Tokyo Bay region was conne'l:ted to sewerage systems in 19Bo. Many municipalities were proposing expansion of
sewerage networks and increasing the capacity of STPs to remove certain wastes. However, the dates when these proposed projects will be completed depends on the financial
conditions of the municipalities. Three levels of proportion connected to sewerage systems were selected for this element of the liquid waste disposal (LW) policy. These were:
1. No change from 19Bo level, i.e., 42%;
2. Connected, as authorized by the long-term sewerage construction program of the
Ministry of Construction;
3. Connected, which is equivalent to the share of the population of the region living in
what are termed "densely populated districts" as defined by the 19Bo census.
With respect to (b), i.e., removal of wastes from discharges, three levels were also
selected. These were: