

154
A.R.D. Stebbing . R.I. Willows
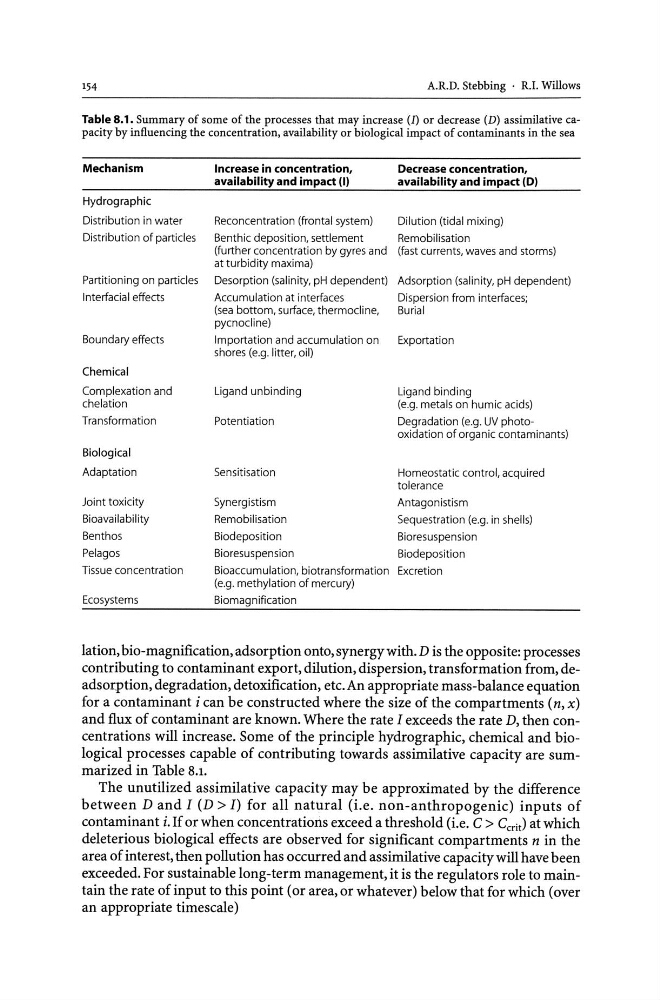
Table 8.1. Summary of some of the processes that may increase (I) or decrease (D) assinlilative capacity by influencing the concentration, availability or biological impact of contaminants in the sea
Mechanism
Hydrographic
Distribution in water
Distribution of particles
Partitioning on particles
I nterfacia I effects
Boundary effects
Chemical
Complexation and
chelation
Transformation
Biological
Adaptation
Joint toxicity
Bioavailability
Benthos
Pelagos
Tissue concentration
Ecosystems
Increase in concentration,
availability and impact (I)
Reconcentration (frontal system)
Decrease concentration,
availability and impact (D)
Dilution (tidal mixing)
Benthic deposition, settlement
Remobilisation
(further concentration by gyres and (fast currents, waves and storms)
at turbidity maxima)
Desorption (salinity, pH dependent) Adsorption (salinity, pH dependent)
Accumulation at interfaces
Dispersion from interfaces;
(sea bottom, surface, thermocline,
Burial
pycnocline)
Importation and accumulation on
Exportation
shores (e.g. litter, oil)
Ligand unbinding
Potentiation
Sensitisation
Synergistism
Remobilisation
Ligand binding
(e.g. metals on humic acids)
Degradation (e.g. UV photooxidation of organic contaminants)
Homeostatic control, acquired
tolerance
Antagonistism
Sequestration (e.g. in shells)
Biodeposition
Bioresuspension
Bioresuspension
Biodeposition
Bioaccumulation, biotransformation Excretion
(e.g. methylation of mercury)
Biomagnification
lation, bio-magnification, adsorption onto, synergy with. D is the opposite: processes
contributing to contaminant export, dilution, dispersion, transformation from, deadsorption, degradation, detoxification, etc. An appropriate mass-balance equation
for a contaminant i can be constructed where the size of the compartments (n, x)
and flux of contaminant are known. Where the rate I exceeds the rate D, then concentrations will increase. Some of the principle hydrographic, chemical and biological processes capable of contributing towards assimilative capacity are summarized in Table 8.1.
The unutilized assimilative capacity may be approximated by the difference
between D and I (D > I) for all natural (i.e. non-anthropogenic) inputs of
contaminant i. If or when concentrations exceed a threshold (i.e. C> Ccrit) at which
deleterious biological effects are observed for significant compartments n in the
area of interest, then pollution has occurred and assimilative capacity will have been
exceeded. For sustainable long-term management, it is the regulators role to maintain the rate of input to this point (or area, or whatever) below that for which (over
an appropriate timescale)
A.R.D. Stebbing . R.I. Willows
Table 8.1. Summary of some of the processes that may increase (I) or decrease (D) assinlilative capacity by influencing the concentration, availability or biological impact of contaminants in the sea
Mechanism
Hydrographic
Distribution in water
Distribution of particles
Partitioning on particles
I nterfacia I effects
Boundary effects
Chemical
Complexation and
chelation
Transformation
Biological
Adaptation
Joint toxicity
Bioavailability
Benthos
Pelagos
Tissue concentration
Ecosystems
Increase in concentration,
availability and impact (I)
Reconcentration (frontal system)
Decrease concentration,
availability and impact (D)
Dilution (tidal mixing)
Benthic deposition, settlement
Remobilisation
(further concentration by gyres and (fast currents, waves and storms)
at turbidity maxima)
Desorption (salinity, pH dependent) Adsorption (salinity, pH dependent)
Accumulation at interfaces
Dispersion from interfaces;
(sea bottom, surface, thermocline,
Burial
pycnocline)
Importation and accumulation on
Exportation
shores (e.g. litter, oil)
Ligand unbinding
Potentiation
Sensitisation
Synergistism
Remobilisation
Ligand binding
(e.g. metals on humic acids)
Degradation (e.g. UV photooxidation of organic contaminants)
Homeostatic control, acquired
tolerance
Antagonistism
Sequestration (e.g. in shells)
Biodeposition
Bioresuspension
Bioresuspension
Biodeposition
Bioaccumulation, biotransformation Excretion
(e.g. methylation of mercury)
Biomagnification
lation, bio-magnification, adsorption onto, synergy with. D is the opposite: processes
contributing to contaminant export, dilution, dispersion, transformation from, deadsorption, degradation, detoxification, etc. An appropriate mass-balance equation
for a contaminant i can be constructed where the size of the compartments (n, x)
and flux of contaminant are known. Where the rate I exceeds the rate D, then concentrations will increase. Some of the principle hydrographic, chemical and biological processes capable of contributing towards assimilative capacity are summarized in Table 8.1.
The unutilized assimilative capacity may be approximated by the difference
between D and I (D > I) for all natural (i.e. non-anthropogenic) inputs of
contaminant i. If or when concentrations exceed a threshold (i.e. C> Ccrit) at which
deleterious biological effects are observed for significant compartments n in the
area of interest, then pollution has occurred and assimilative capacity will have been
exceeded. For sustainable long-term management, it is the regulators role to maintain the rate of input to this point (or area, or whatever) below that for which (over
an appropriate timescale)