

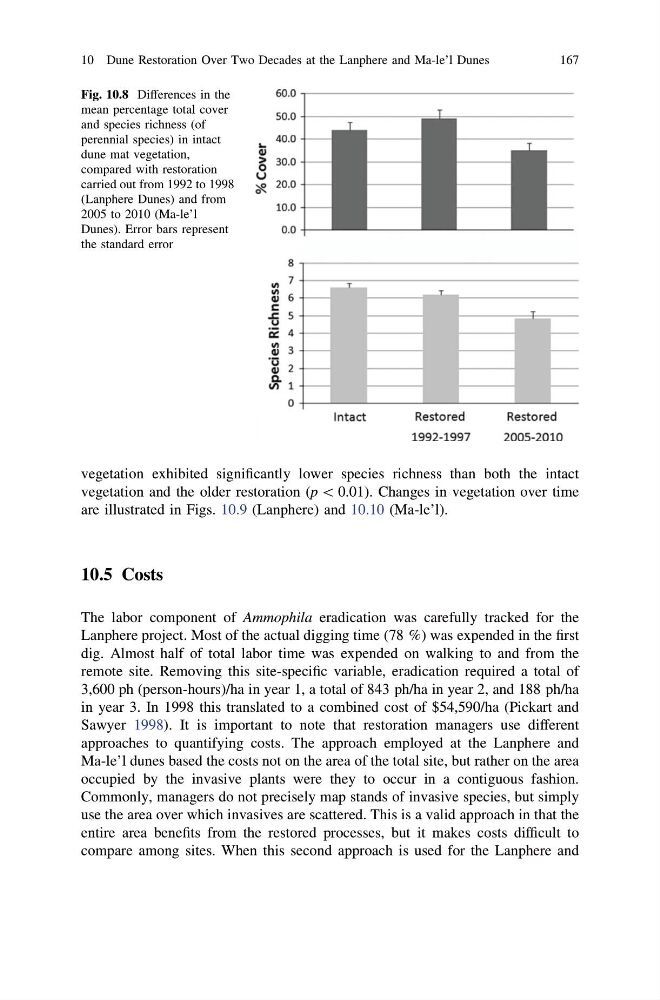
vegetation exhibited significantly lower species richness than both the intact
vegetation and the older restoration (p \ 0.01). Changes in vegetation over time
are illustrated in Figs. 10.9 (Lanphere) and 10.10 (Ma-le’l).
10.5 Costs
The labor component of Ammophila eradication was carefully tracked for the
Lanphere project. Most of the actual digging time (78 %) was expended in the first
dig. Almost half of total labor time was expended on walking to and from the
remote site. Removing this site-specific variable, eradication required a total of
3,600 ph (person-hours)/ha in year 1, a total of 843 ph/ha in year 2, and 188 ph/ha
in year 3. In 1998 this translated to a combined cost of $54,590/ha (Pickart and
Sawyer 1998). It is important to note that restoration managers use different
approaches to quantifying costs. The approach employed at the Lanphere and
Ma-le’l dunes based the costs not on the area of the total site, but rather on the area
occupied by the invasive plants were they to occur in a contiguous fashion.
Commonly, managers do not precisely map stands of invasive species, but simply
use the area over which invasives are scattered. This is a valid approach in that the
entire area benefits from the restored processes, but it makes costs difficult to
compare among sites. When this second approach is used for the Lanphere and
Fig. 10.8 Differences in the
mean percentage total cover
and species richness (of
perennial species) in intact
dune mat vegetation,
compared with restoration
carried out from 1992 to 1998
(Lanphere Dunes) and from
2005 to 2010 (Ma-le’l
Dunes). Error bars represent
the standard error
10 Dune Restoration Over Two Decades at the Lanphere and Ma-le’l Dunes
167
vegetation and the older restoration (p \ 0.01). Changes in vegetation over time
are illustrated in Figs. 10.9 (Lanphere) and 10.10 (Ma-le’l).
10.5 Costs
The labor component of Ammophila eradication was carefully tracked for the
Lanphere project. Most of the actual digging time (78 %) was expended in the first
dig. Almost half of total labor time was expended on walking to and from the
remote site. Removing this site-specific variable, eradication required a total of
3,600 ph (person-hours)/ha in year 1, a total of 843 ph/ha in year 2, and 188 ph/ha
in year 3. In 1998 this translated to a combined cost of $54,590/ha (Pickart and
Sawyer 1998). It is important to note that restoration managers use different
approaches to quantifying costs. The approach employed at the Lanphere and
Ma-le’l dunes based the costs not on the area of the total site, but rather on the area
occupied by the invasive plants were they to occur in a contiguous fashion.
Commonly, managers do not precisely map stands of invasive species, but simply
use the area over which invasives are scattered. This is a valid approach in that the
entire area benefits from the restored processes, but it makes costs difficult to
compare among sites. When this second approach is used for the Lanphere and
Fig. 10.8 Differences in the
mean percentage total cover
and species richness (of
perennial species) in intact
dune mat vegetation,
compared with restoration
carried out from 1992 to 1998
(Lanphere Dunes) and from
2005 to 2010 (Ma-le’l
Dunes). Error bars represent
the standard error
10 Dune Restoration Over Two Decades at the Lanphere and Ma-le’l Dunes
167