

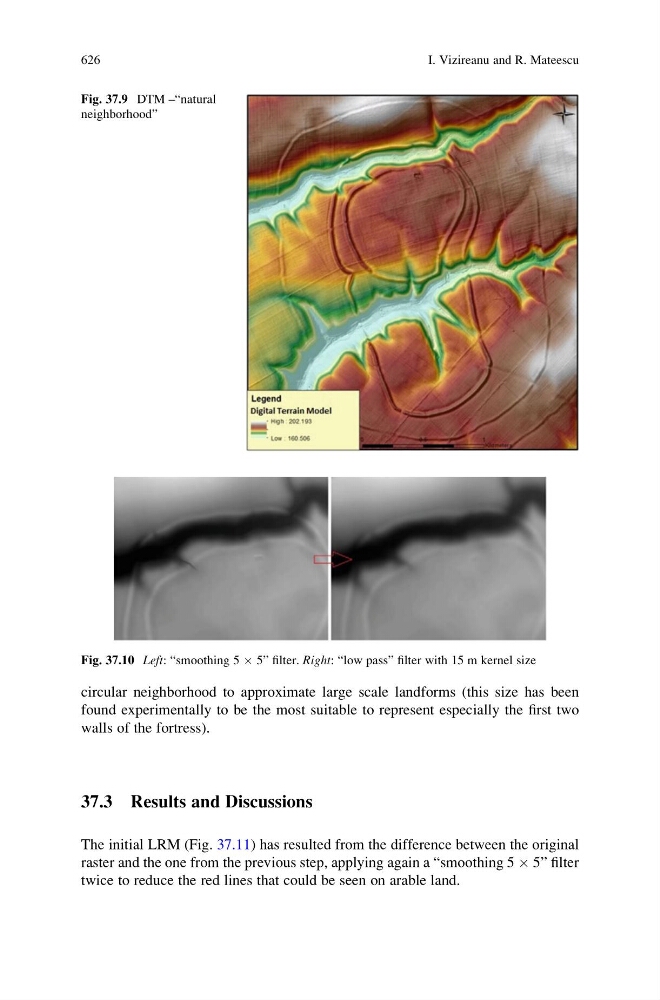
circular neighborhood to approximate large scale landforms (this size has been
found experimentally to be the most suitable to represent especially the first two
walls of the fortress).
37.3 Results and Discussions
The initial LRM (Fig. 37.11) has resulted from the difference between the original
raster and the one from the previous step, applying again a “smoothing 5 Â 5” filter
twice to reduce the red lines that could be seen on arable land.
Fig. 37.9 DTM –“natural
neighborhood”
Fig. 37.10 Left: “smoothing 5 Â 5” filter. Right: “low pass” filter with 15 m kernel size
626
I. Vizireanu and R. Mateescu