

hydrogen sulfide zone, as well as the presence of the shelf, which is located in the
northwestern part of the sea with an area of 60,000 km
2 (Mee 1992; Ivanov and
Belokopytov 2011).
According to the literature the most complete summary of the results of research of
income of nutrients (nitrogen and phosphorus) in the Black Sea during the period
(1950–2000) is presented in the work (Garkavaya and Bogatova 2006). According to
estimates the average annual flow of phosphates with the river runoff of the Danube,
the Dnieper, the Dniester and the Southern Bug in the period (1950–1960) in the
north-western part of the sea (NWPM) was 15,000 tP∙year
À1
. However, over the
5-year period (1980–1985) the average annual income of phosphorus with the runoff
of the rivers flowing into the Black Sea basin from the territories (Russia, Ukraine,
Bulgaria, Romania, Turkey, Georgia) increased sharply and amounted to –
52,000 tP∙year
À1 (Gubanov 1992). At the same time, the value of this indicator for
the ten-year period (1980–1990) was slightly lower and amounted to 44,600 tP∙year
À1
(Garkavaya and Bogatova 2006). In more recent studies, since 1993 to 1996, carried
out in the framework of an international project with the participation of researchers
from Russia, Ukraine, Bulgaria, Romania, Turkey, Georgia close value of this index is
equal to 42,604 tP∙year
À1 was obtained (The Black Sea 1997). At the same time, it is
estimated (Garkavaya and Bogatova 2006) the average value of income of phosphorus
to the river flow over a ten year period (1990–2000) sharply decreased and amounted
to 22,000 tP∙year
À1 (Garkavaya and Bogatova 2006), which is practically comparable
with the value of this parameter obtained in period (1950–1960). From the above
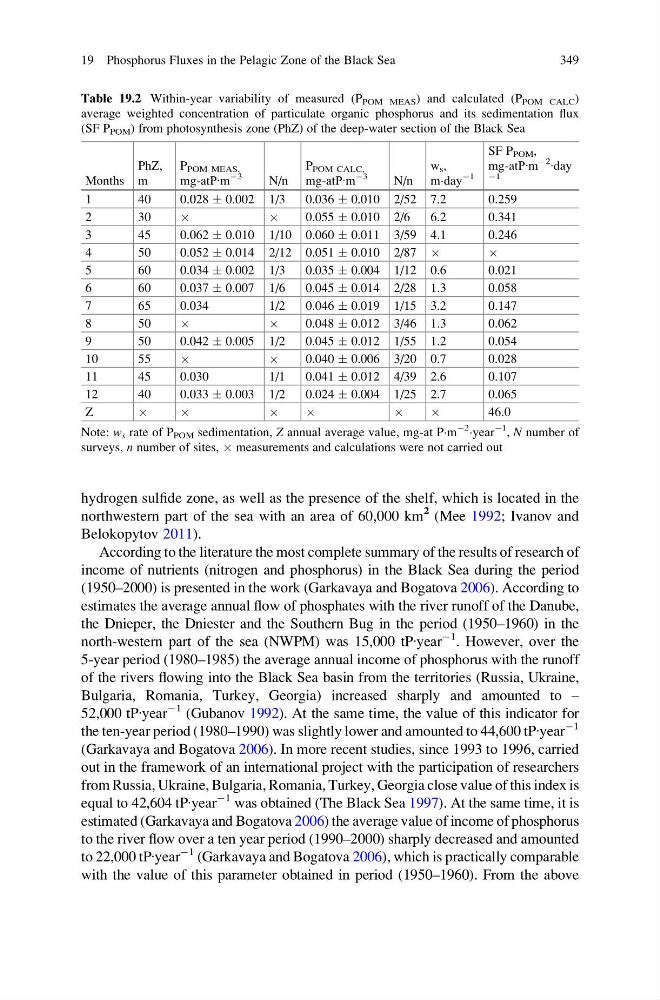
Table 19.2 Within-year variability of measured (P POM MEAS ) and calculated (P POM CALC )
average weighted concentration of particulate organic phosphorus and its sedimentation flux
(SF P POM ) from photosynthesis zone (PhZ) of the deep-water section of the Black Sea
Months
PhZ,
m
P POM MEAS,
mg-atР∙m
À3
N/n
P POM CALC,
mg-atР∙m
À3
N/n
w s ,
mÁday
À1
SF P POM ,
mg-atР∙m
À2
∙day
À1
1
40
0.028 Æ 0.002 1/3
0.036 Æ 0.010 2/52 7.2
0.259
2
3 0
Â
Â
0.055 Æ 0.010 2/6
6.2
0.341
3
45
0.062 Æ 0.010 1/10 0.060 Æ 0.011 3/59 4.1
0.246
4
50
0.052 Æ 0.014 2/12 0.051 Æ 0.010 2/87 Â
Â
5
60
0.034 Æ 0.002 1/3
0.035 Æ 0.004 1/12 0.6
0.021
6
60
0.037 Æ 0.007 1/6
0.045 Æ 0.014 2/28 1.3
0.058
7
65
0.034
1/2
0.046 Æ 0.019 1/15 3.2
0.147
8
5 0
Â
Â
0.048 Æ 0.012 3/46 1.3
0.062
9
50
0.042 Æ 0.005 1/2
0.045 Æ 0.012 1/55 1.2
0.054
10
55
Â
Â
0.040 Æ 0.006 3/20 0.7
0.028
11
45
0.030
1/1
0.041 Æ 0.012 4/39 2.6
0.107
12
40
0.033 Æ 0.003 1/2
0.024 Æ 0.004 1/25 2.7
0.065
Z
Â
Â
Â
Â
Â
Â
46.0
Note: w s rate of P POM sedimentation, Z annual average value, mg-at PÁm
À2
Áyear
À1
, N number of
surveys, n number of sites, Â measurements and calculations were not carried out
19 Phosphorus Fluxes in the Pelagic Zone of the Black Sea
349
northwestern part of the sea with an area of 60,000 km
2 (Mee 1992; Ivanov and
Belokopytov 2011).
According to the literature the most complete summary of the results of research of
income of nutrients (nitrogen and phosphorus) in the Black Sea during the period
(1950–2000) is presented in the work (Garkavaya and Bogatova 2006). According to
estimates the average annual flow of phosphates with the river runoff of the Danube,
the Dnieper, the Dniester and the Southern Bug in the period (1950–1960) in the
north-western part of the sea (NWPM) was 15,000 tP∙year
À1
. However, over the
5-year period (1980–1985) the average annual income of phosphorus with the runoff
of the rivers flowing into the Black Sea basin from the territories (Russia, Ukraine,
Bulgaria, Romania, Turkey, Georgia) increased sharply and amounted to –
52,000 tP∙year
À1 (Gubanov 1992). At the same time, the value of this indicator for
the ten-year period (1980–1990) was slightly lower and amounted to 44,600 tP∙year
À1
(Garkavaya and Bogatova 2006). In more recent studies, since 1993 to 1996, carried
out in the framework of an international project with the participation of researchers
from Russia, Ukraine, Bulgaria, Romania, Turkey, Georgia close value of this index is
equal to 42,604 tP∙year
À1 was obtained (The Black Sea 1997). At the same time, it is
estimated (Garkavaya and Bogatova 2006) the average value of income of phosphorus
to the river flow over a ten year period (1990–2000) sharply decreased and amounted
to 22,000 tP∙year
À1 (Garkavaya and Bogatova 2006), which is practically comparable
with the value of this parameter obtained in period (1950–1960). From the above
Table 19.2 Within-year variability of measured (P POM MEAS ) and calculated (P POM CALC )
average weighted concentration of particulate organic phosphorus and its sedimentation flux
(SF P POM ) from photosynthesis zone (PhZ) of the deep-water section of the Black Sea
Months
PhZ,
m
P POM MEAS,
mg-atР∙m
À3
N/n
P POM CALC,
mg-atР∙m
À3
N/n
w s ,
mÁday
À1
SF P POM ,
mg-atР∙m
À2
∙day
À1
1
40
0.028 Æ 0.002 1/3
0.036 Æ 0.010 2/52 7.2
0.259
2
3 0
Â
Â
0.055 Æ 0.010 2/6
6.2
0.341
3
45
0.062 Æ 0.010 1/10 0.060 Æ 0.011 3/59 4.1
0.246
4
50
0.052 Æ 0.014 2/12 0.051 Æ 0.010 2/87 Â
Â
5
60
0.034 Æ 0.002 1/3
0.035 Æ 0.004 1/12 0.6
0.021
6
60
0.037 Æ 0.007 1/6
0.045 Æ 0.014 2/28 1.3
0.058
7
65
0.034
1/2
0.046 Æ 0.019 1/15 3.2
0.147
8
5 0
Â
Â
0.048 Æ 0.012 3/46 1.3
0.062
9
50
0.042 Æ 0.005 1/2
0.045 Æ 0.012 1/55 1.2
0.054
10
55
Â
Â
0.040 Æ 0.006 3/20 0.7
0.028
11
45
0.030
1/1
0.041 Æ 0.012 4/39 2.6
0.107
12
40
0.033 Æ 0.003 1/2
0.024 Æ 0.004 1/25 2.7
0.065
Z
Â
Â
Â
Â
Â
Â
46.0
Note: w s rate of P POM sedimentation, Z annual average value, mg-at PÁm
À2
Áyear
À1
, N number of
surveys, n number of sites, Â measurements and calculations were not carried out
19 Phosphorus Fluxes in the Pelagic Zone of the Black Sea
349