

precision of model calculations. Thus, we use different approaches to calculate flux
sedimentation P POM of photosynthesis zone, which are based on both instrumental
measurements and theoretical backgrounds. This let us properly assess its seasonal
variability and average annual value in the deepwater area of the Black Sea.
Comparison of average annual values of the upward flux of phosphorus and
sediment flux P POM derived from of the deer area of the Black Sea showed that
they were respectively 48 and 46 mg-atP∙m
À2
∙year
À1 and their ratio corresponds to
almost one. This ratio indicates the average balance of processes average annual
income of phosphorus and its sediment removal from the photosynthetic zone
deepwater area of the Black Sea.
19.3 Assessment of Phosphorus Income from Outside
Sources in the Black Sea
The Black Sea, since 1970 is under constant pressure by chemical pollution from
land-based sources and atmospheric precipitation. This is due primarily to its
geographic location and the huge catchment area of 1,760,000 km
2 (Mikhailov
and Mikhailova 2008), where a population of about 162 million people live and
high industrial, agricultural and resort potential is located (Mee 1992). Furthermore, it is necessary to take into consideration a number of distinctive features of
the Sea, such as limited water exchange through the Bosporus Strait, the presence of
small thickness (150–200) m of the upper layer of oxygen relative depth of
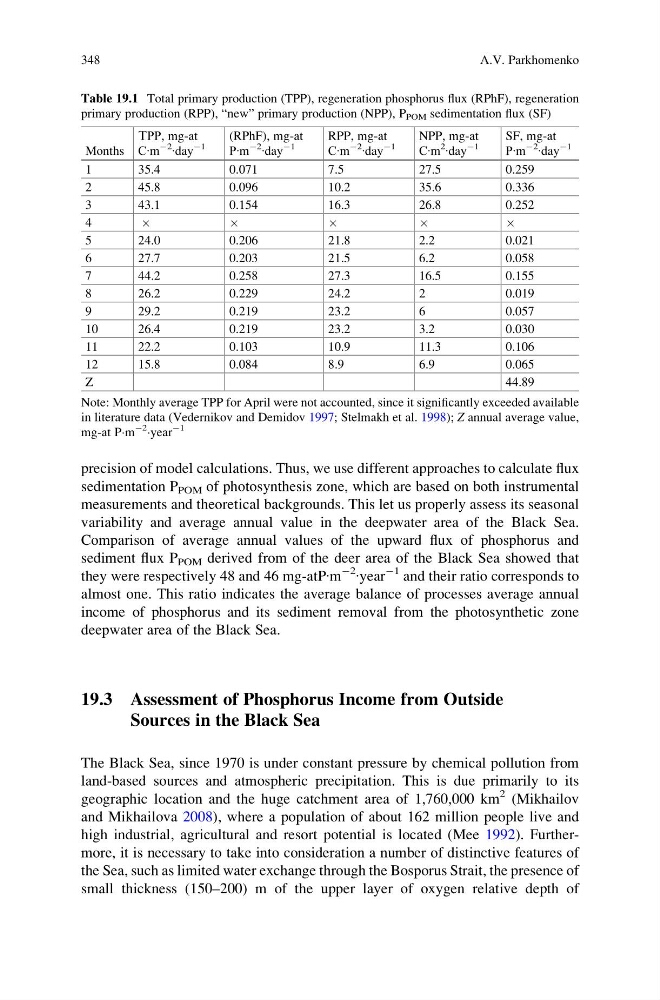
Table 19.1 Total primary production (TPP), regeneration phosphorus flux (RPhF), regeneration
primary production (RPP), “new” primary production (NPP), P POM sedimentation flux (SF)
Months
ТРР, mg-at
С∙m
À2
∙day
À1
(RPhF), mg-at
Р∙m
À2 ∙day
À1
RPP, mg-at
С∙m
À2
∙day
À1
NPP, mg-at
С∙m
2
∙day
À1
SF, mg-at
Р∙m
À2
∙day
À1
1
35.4
0.071
7.5
27.5
0.259
2
45.8
0.096
10.2
35.6
0.336
3
43.1
0.154
16.3
26.8
0.252
4
Â
Â
Â
Â
Â
5
24.0
0.206
21.8
2.2
0.021
6
27.7
0.203
21.5
6.2
0.058
7
44.2
0.258
27.3
16.5
0.155
8
26.2
0.229
24.2
2
0.019
9
29.2
0.219
23.2
6
0.057
10
26.4
0.219
23.2
3.2
0.030
11
22.2
0.103
10.9
11.3
0.106
12
15.8
0.084
8.9
6.9
0.065
Z
44.89
Note: Monthly average TPP for April were not accounted, since it significantly exceeded available
in literature data (Vedernikov and Demidov 1997; Stelmakh et al. 1998); Z annual average value,
mg-at PÁm
À2
Áyear
À1
348
A.V. Parkhomenko
sedimentation P POM of photosynthesis zone, which are based on both instrumental
measurements and theoretical backgrounds. This let us properly assess its seasonal
variability and average annual value in the deepwater area of the Black Sea.
Comparison of average annual values of the upward flux of phosphorus and
sediment flux P POM derived from of the deer area of the Black Sea showed that
they were respectively 48 and 46 mg-atP∙m
À2
∙year
À1 and their ratio corresponds to
almost one. This ratio indicates the average balance of processes average annual
income of phosphorus and its sediment removal from the photosynthetic zone
deepwater area of the Black Sea.
19.3 Assessment of Phosphorus Income from Outside
Sources in the Black Sea
The Black Sea, since 1970 is under constant pressure by chemical pollution from
land-based sources and atmospheric precipitation. This is due primarily to its
geographic location and the huge catchment area of 1,760,000 km
2 (Mikhailov
and Mikhailova 2008), where a population of about 162 million people live and
high industrial, agricultural and resort potential is located (Mee 1992). Furthermore, it is necessary to take into consideration a number of distinctive features of
the Sea, such as limited water exchange through the Bosporus Strait, the presence of
small thickness (150–200) m of the upper layer of oxygen relative depth of
Table 19.1 Total primary production (TPP), regeneration phosphorus flux (RPhF), regeneration
primary production (RPP), “new” primary production (NPP), P POM sedimentation flux (SF)
Months
ТРР, mg-at
С∙m
À2
∙day
À1
(RPhF), mg-at
Р∙m
À2 ∙day
À1
RPP, mg-at
С∙m
À2
∙day
À1
NPP, mg-at
С∙m
2
∙day
À1
SF, mg-at
Р∙m
À2
∙day
À1
1
35.4
0.071
7.5
27.5
0.259
2
45.8
0.096
10.2
35.6
0.336
3
43.1
0.154
16.3
26.8
0.252
4
Â
Â
Â
Â
Â
5
24.0
0.206
21.8
2.2
0.021
6
27.7
0.203
21.5
6.2
0.058
7
44.2
0.258
27.3
16.5
0.155
8
26.2
0.229
24.2
2
0.019
9
29.2
0.219
23.2
6
0.057
10
26.4
0.219
23.2
3.2
0.030
11
22.2
0.103
10.9
11.3
0.106
12
15.8
0.084
8.9
6.9
0.065
Z
44.89
Note: Monthly average TPP for April were not accounted, since it significantly exceeded available
in literature data (Vedernikov and Demidov 1997; Stelmakh et al. 1998); Z annual average value,
mg-at PÁm
À2
Áyear
À1
348
A.V. Parkhomenko