

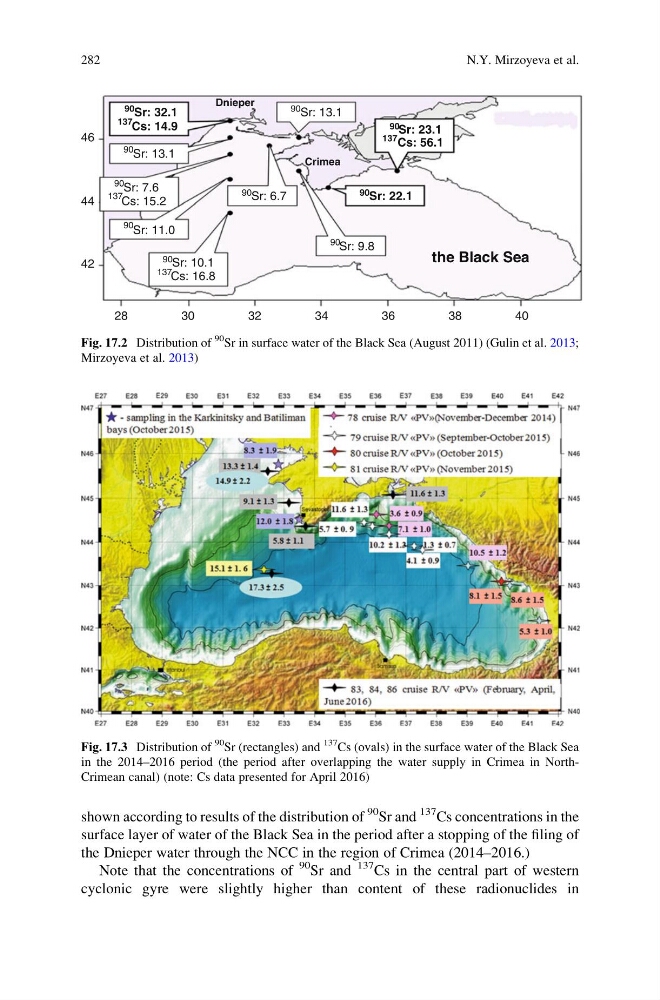
shown according to results of the distribution of
90 Sr and
137
Cs concentrations in the
surface layer of water of the Black Sea in the period after a stopping of the filing of
the Dnieper water through the NCC in the region of Crimea (2014–2016.)
Note that the concentrations of
90 Sr and
137 Cs in the central part of western
cyclonic gyre were slightly higher than content of these radionuclides in
28
42
44
46
32
34
36
38
40
30
Sr: 11.0
Sr: 10.1
Sr: 7.6
Sr: 13.1
Sr: 32.1
Sr: 9.8
Sr: 6.7
Sr: 13.1
Sr: 22.1
Sr: 23.1
Cs: 56.1
Cs: 16.8
Cs: 15.2
Cs: 14.9
137
90
Dnieper
Crimea
137
137
137
90
90
90
90
90
90
90
90
90
the Black Sea
Fig. 17.2 Distribution of
90
Sr in surface water of the Black Sea (August 2011) (Gulin et al. 2013;
Mirzoyeva et al. 2013)
Fig. 17.3 Distribution of
90
Sr (rectangles) and
137
Cs (ovals) in the surface water of the Black Sea
in the 2014–2016 period (the period after overlapping the water supply in Crimea in NorthCrimean canal) (note: Cs data presented for April 2016)
282
N.Y. Mirzoyeva et al.
90 Sr and
137
Cs concentrations in the
surface layer of water of the Black Sea in the period after a stopping of the filing of
the Dnieper water through the NCC in the region of Crimea (2014–2016.)
Note that the concentrations of
90 Sr and
137 Cs in the central part of western
cyclonic gyre were slightly higher than content of these radionuclides in
28
42
44
46
32
34
36
38
40
30
Sr: 11.0
Sr: 10.1
Sr: 7.6
Sr: 13.1
Sr: 32.1
Sr: 9.8
Sr: 6.7
Sr: 13.1
Sr: 22.1
Sr: 23.1
Cs: 56.1
Cs: 16.8
Cs: 15.2
Cs: 14.9
137
90
Dnieper
Crimea
137
137
137
90
90
90
90
90
90
90
90
90
the Black Sea
Fig. 17.2 Distribution of
90
Sr in surface water of the Black Sea (August 2011) (Gulin et al. 2013;
Mirzoyeva et al. 2013)
Fig. 17.3 Distribution of
90
Sr (rectangles) and
137
Cs (ovals) in the surface water of the Black Sea
in the 2014–2016 period (the period after overlapping the water supply in Crimea in NorthCrimean canal) (note: Cs data presented for April 2016)
282
N.Y. Mirzoyeva et al.