

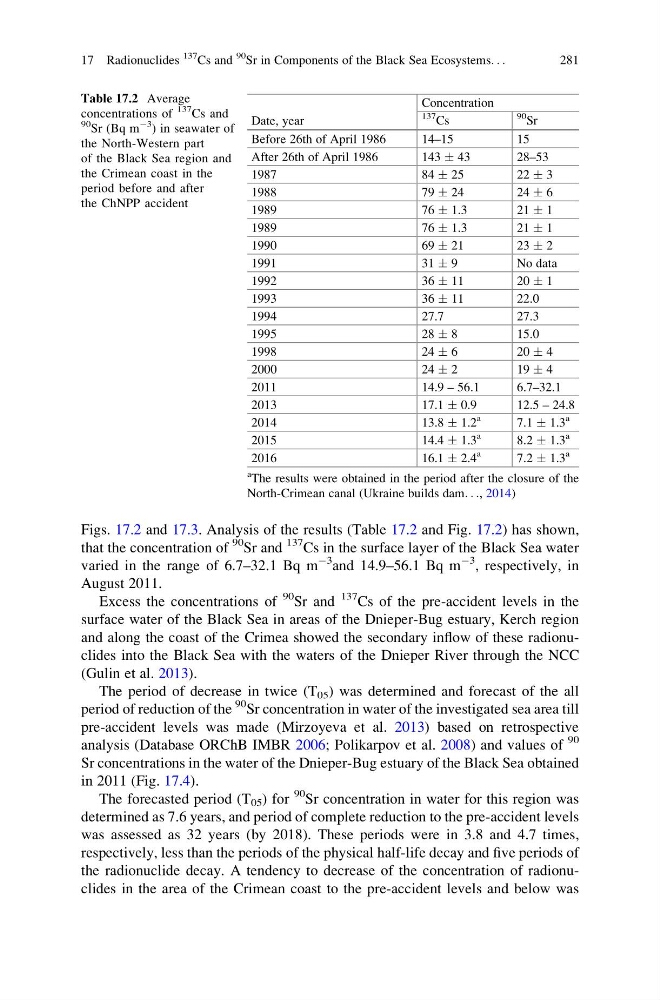
Figs. 17.2 and 17.3. Analysis of the results (Table 17.2 and Fig. 17.2) has shown,
that the concentration of
90 Sr and
137 Cs in the surface layer of the Black Sea water
varied in the range of 6.7–32.1 Bq m
À3 and 14.9–56.1 Bq m
À3 , respectively, in
August 2011.
Excess the concentrations of
90 Sr and
137 Cs of the pre-accident levels in the
surface water of the Black Sea in areas of the Dnieper-Bug estuary, Kerch region
and along the coast of the Crimea showed the secondary inflow of these radionuclides into the Black Sea with the waters of the Dnieper River through the NCC
(Gulin et al. 2013).
The period of decrease in twice (T 05 ) was determined and forecast of the all
period of reduction of the
90 Sr concentration in water of the investigated sea area till
pre-accident levels was made (Mirzoyeva et al. 2013) based on retrospective
analysis (Database ORChB IMBR 2006; Polikarpov et al. 2008) and values of
90
Sr concentrations in the water of the Dnieper-Bug estuary of the Black Sea obtained
in 2011 (Fig. 17.4).
The forecasted period (T 05 ) for
90
Sr concentration in water for this region was
determined as 7.6 years, and period of complete reduction to the pre-accident levels
was assessed as 32 years (by 2018). These periods were in 3.8 and 4.7 times,
respectively, less than the periods of the physical half-life decay and five periods of
the radionuclide decay. A tendency to decrease of the concentration of radionuclides in the area of the Crimean coast to the pre-accident levels and below was
Table 17.2 Average
concentrations of
137 Cs and
90 Sr (Bq m
À3 ) in seawater of
the North-Western part
of the Black Sea region and
the Crimean coast in the
period before and after
the ChNPP accident
Date, year
Concentration
137
Cs
90
Sr
Before 26th of April 1986
14–15
15
After 26th of April 1986
143 Æ 43
28–53
1987
84 Æ 25
22 Æ 3
1988
79 Æ 24
24 Æ 6
1989
76 Æ 1.3
21 Æ 1
1989
76 Æ 1.3
21 Æ 1
1990
69 Æ 21
23 Æ 2
1991
31 Æ 9
No data
1992
36 Æ 11
20 Æ 1
1993
36 Æ 11
22.0
1994
27.7
27.3
1995
28 Æ 8
15.0
1998
24 Æ 6
2 0Æ 4
2000
24 Æ 2
1 9Æ 4
2011
14.9 – 56.1
6.7–32.1
2013
17.1 Æ 0.9
12.5 – 24.8
2014
13.8 Æ 1.2
a
7.1 Æ 1.3
a
2015
14.4 Æ 1.3
a
8.2 Æ 1.3
a
2016
16.1 Æ 2.4
a
7.2 Æ 1.3
a
a
The results were obtained in the period after the closure of the
North-Crimean canal (Ukraine builds dam. . ., 2014)
17 Radionuclides
137
Cs and
90
Sr in Components of the Black Sea Ecosystems. . .
281
that the concentration of
90 Sr and
137 Cs in the surface layer of the Black Sea water
varied in the range of 6.7–32.1 Bq m
À3 and 14.9–56.1 Bq m
À3 , respectively, in
August 2011.
Excess the concentrations of
90 Sr and
137 Cs of the pre-accident levels in the
surface water of the Black Sea in areas of the Dnieper-Bug estuary, Kerch region
and along the coast of the Crimea showed the secondary inflow of these radionuclides into the Black Sea with the waters of the Dnieper River through the NCC
(Gulin et al. 2013).
The period of decrease in twice (T 05 ) was determined and forecast of the all
period of reduction of the
90 Sr concentration in water of the investigated sea area till
pre-accident levels was made (Mirzoyeva et al. 2013) based on retrospective
analysis (Database ORChB IMBR 2006; Polikarpov et al. 2008) and values of
90
Sr concentrations in the water of the Dnieper-Bug estuary of the Black Sea obtained
in 2011 (Fig. 17.4).
The forecasted period (T 05 ) for
90
Sr concentration in water for this region was
determined as 7.6 years, and period of complete reduction to the pre-accident levels
was assessed as 32 years (by 2018). These periods were in 3.8 and 4.7 times,
respectively, less than the periods of the physical half-life decay and five periods of
the radionuclide decay. A tendency to decrease of the concentration of radionuclides in the area of the Crimean coast to the pre-accident levels and below was
Table 17.2 Average
concentrations of
137 Cs and
90 Sr (Bq m
À3 ) in seawater of
the North-Western part
of the Black Sea region and
the Crimean coast in the
period before and after
the ChNPP accident
Date, year
Concentration
137
Cs
90
Sr
Before 26th of April 1986
14–15
15
After 26th of April 1986
143 Æ 43
28–53
1987
84 Æ 25
22 Æ 3
1988
79 Æ 24
24 Æ 6
1989
76 Æ 1.3
21 Æ 1
1989
76 Æ 1.3
21 Æ 1
1990
69 Æ 21
23 Æ 2
1991
31 Æ 9
No data
1992
36 Æ 11
20 Æ 1
1993
36 Æ 11
22.0
1994
27.7
27.3
1995
28 Æ 8
15.0
1998
24 Æ 6
2 0Æ 4
2000
24 Æ 2
1 9Æ 4
2011
14.9 – 56.1
6.7–32.1
2013
17.1 Æ 0.9
12.5 – 24.8
2014
13.8 Æ 1.2
a
7.1 Æ 1.3
a
2015
14.4 Æ 1.3
a
8.2 Æ 1.3
a
2016
16.1 Æ 2.4
a
7.2 Æ 1.3
a
a
The results were obtained in the period after the closure of the
North-Crimean canal (Ukraine builds dam. . ., 2014)
17 Radionuclides
137
Cs and
90
Sr in Components of the Black Sea Ecosystems. . .
281